低波動 飆股長相
def compute_candle_volatility(timeperiod=20):
    close = data.get("price:收盤價")
    high = data.get("price:最高價")
    low = data.get("price:最低價")
    open_ = data.get("price:開盤價")

    bullish_candle = close >= open_
    bullish_volatility = (
        abs(close.shift() - open_)
        + abs(open_ - low)
        + abs(low - high)
        + abs(high - close)
    )
    bearish_volatility = (
        abs(close.shift() - open_)
        + abs(open_ - high)
        + abs(high - low)
        + abs(low - close)
    )
    candle_volatility = FinlabDataFrame(
        np.nan, index=close.index, columns=close.columns
    )
    candle_volatility[bullish_candle] = bullish_volatility
    candle_volatility[~bullish_candle] = bearish_volatility
    volatility = (
        candle_volatility.average(timeperiod) / close.average(timeperiod) * 100
    )
    return volatility
收盤價跟月營收合併
import finlab
import pandas as pd
from finlab import data

pd.options.display.float_format = lambda x: "%.2f" % x


if __name__ == "__main__":
    close = data.get("price:收盤價")
    rev = data.get("monthly_revenue:當月營收")
    print(close)
    print(rev)

    merged_df = close.merge(rev, on='date', how='left', suffixes=('_close', '_rev'))
    merged_df.fillna(method='bfill', inplace=True)
    print(merged_df, merged_df.columns)
    print(merged_df['2330_close'], merged_df['2330_rev'])
臺股漲跌與市值板塊圖
出處: https://www.finlab.tw/dashboard2-plotly-treemap/
import pandas as pd
import numpy as np
import finlab
from finlab import data
import plotly.express as px


"""
https://www.finlab.tw/dashboard2-plotly-treemap/
Treemap
"""


def df_date_filter(df, start=None, end=None):
    if start:
        df = df[df.index >= start]
    if end:
        df = df[df.index <= end]
    return df


def create_treemap_data(start, end, item, clip=None):
    close = data.get("price:收盤價")
    basic_info = data.get("company_basic_info")
    turnover = data.get("price:成交金額")
    close_data = df_date_filter(close, start, end)
    turnover_data = df_date_filter(turnover, start, end).iloc[1:].sum() / 100000000
    return_ratio = (
        (close_data.iloc[-1] / close_data.iloc[-2]).dropna().replace(np.inf, 0)
    )
    return_ratio = round((return_ratio - 1) * 100, 2)

    concat_list = [close_data.iloc[-1], turnover_data, return_ratio]
    col_names = ["stock_id", "close", "turnover", "return_ratio"]
    if item not in ["return_ratio", "turnover_ratio"]:
        try:
            custom_item = df_date_filter(data.get(item), start, end).iloc[-1].fillna(0)
        except Exception as e:
            logger.error("data error, check the data is existed between start and end.")
            logger.error(e)
            return None
        if clip:
            custom_item = custom_item.clip(*clip)
        concat_list.append(custom_item)
        col_names.append(item)

    df = pd.concat(concat_list, axis=1).dropna()
    df = df.reset_index()
    df.columns = col_names

    basic_info_df = basic_info.copy()
    basic_info_df["stock_id_name"] = basic_info_df["stock_id"] + basic_info_df["公司簡稱"]

    df = df.merge(
        basic_info_df[["stock_id", "stock_id_name", "產業類別", "市場別", "實收資本額(元)"]],
        how="left",
        on="stock_id",
    )
    df = df.rename(columns={"產業類別": "category", "市場別": "market", "實收資本額(元)": "base"})
    df = df.dropna(thresh=5)
    df["market_value"] = round(df["base"] / 10 * df["close"] / 100000000, 2)
    df["turnover_ratio"] = df["turnover"] / (df["turnover"].sum()) * 100
    df["country"] = "TW-Stock"
    return df


def plot_tw_stock_treemap(
    start=None,
    end=None,
    area_ind="market_value",
    item="return_ratio",
    clip=None,
    color_scales="Temps",
):
    """Plot treemap chart for tw_stock

    Treemap charts visualize hierarchical data using nested rectangles,
    it is good for judging the overall market dynamics.

    Args:
      start(str): The date of data start point.ex:2021-01-02
      end(str):The date of data end point.ex:2021-01-05
      area_ind(str):The indicator to control treemap area size .
                    Select range is in ["market_value","turnover","turnover_ratio"]
      item(str): The indicator to control treemap area color .
                 Select range is in ["return_ratio", "turnover_ratio"]
                 or use the other customized data which you could find from finlab database page,
                 ex:'price_earning_ratio:本益比'
      clip(tuple):lower and upper pd.clip() setting for item values to make distinct colors.ex:(0,100)
      color_scales(str):Used for the built-in named continuous
                        (sequential, diverging and cyclical) color scales in Plotly
                        Ref:https://plotly.com/python/builtin-colorscales/
    Returns:
        figure
    """
    df = create_treemap_data(start, end, item, clip)
    if df is None:
        return None
    df["custom_item_label"] = round(df[item], 2).astype(str)

    if area_ind not in ["market_value", "turnover", "turnover_ratio"]:
        return None

    if item in ["return_ratio"]:
        color_continuous_midpoint = 0
    else:
        color_continuous_midpoint = np.average(df[item], weights=df[area_ind])

    fig = px.treemap(
        df,
        path=["country", "market", "category", "stock_id_name"],
        values=area_ind,
        color=item,
        color_continuous_scale=color_scales,
        color_continuous_midpoint=color_continuous_midpoint,
        custom_data=["custom_item_label", "close", "turnover"],
        title=f"TW-Stock Market TreeMap({start}~{end})"
        f"---area_ind:{area_ind}---item:{item}",
        width=1600,
        height=800,
    )

    fig.update_traces(
        textposition="middle center",
        textfont_size=24,
        texttemplate="%{label}(%{customdata[1]})<br>%{customdata[0]}",
    )
    return fig


if __name__ == "__main__":
    # @title 臺股漲跌與市值板塊圖
    start = "2021-07-01"  # @param {type:"date"}
    end = "2021-07-02"  # @param {type:"date"}
    area_ind = "turnover_ratio"  # @param ["market_value","turnover","turnover_ratio"] {allow-input: true}
    item = (
        "return_ratio"  # @param ["return_ratio", "turnover_ratio"] {allow-input: true}
    )
    clip = 1000  # @param {type:"number"}

    plot_tw_stock_treemap(start, end, area_ind, item, clip)
finlab 的 mae gmfe bmfe
以 2063 世鎧 mae 是 0 代表 2023-01-03 進場~ 2023-02-01 出場 的所有日K open 價都高過 進場當天開盤價
是以進場價格做基準點~ 藏獒策略以開盤價進場 開盤價出場
| trade_index | stock_id | entry_date | exit_date | entry_sig_date | exit_sig_date | return | trade_price@entry_date | trade_price@exit_date | mae | gmfe | bmfe | mdd | return_include_fee |
|---|---|---|---|---|---|---|---|---|---|---|---|---|---|
| 630 | 2063 世鎧 | 2023-01-03 | 2023-02-01 | 2022-12-30 | 2023-01-31 | 0.0159 | 43.9000 | 44.6000 | 0.0000 | 0.0342 | 0.0000 | -0.0287 | 1.0000 |
| 631 | 3498 陽程 | 2023-01-03 | 2023-02-01 | 2022-12-30 | 2023-01-31 | -0.0225 | 37.8000 | 36.9500 | -0.0542 | 0.0582 | 0.0582 | -0.1062 | -2.8200 |
| 632 | 8996 高力 | 2023-01-03 | 2023-02-01 | 2022-12-30 | 2023-01-31 | 0.1568 | 185.0000 | 214.0000 | -0.0270 | 0.1568 | 0.0270 | -0.0526 | 15.0000 |
| 633 | 1104 環泥 | 2023-02-01 | 2023-03-01 | 2023-01-31 | 2023-02-24 | 0.0253 | 23.7000 | 24.3000 | -0.0042 | 0.0316 | 0.0274 | -0.0308 | 1.9300 |
| 634 | 1707 葡萄王 | 2023-01-03 | 2023-03-01 | 2022-12-30 | 2023-02-24 | 0.0737 | 169.5000 | 182.0000 | -0.0619 | 0.0737 | 0.0000 | -0.0619 | 6.7500 |
| 635 | 2727 王品 | 2023-02-01 | 2023-03-01 | 2023-01-31 | 2023-02-24 | 0.4865 | 185.0000 | 275.0000 | 0.0000 | 0.4865 | 0.0000 | -0.0455 | 47.7800 |
| 636 | 6612 奈米醫材 | 2023-02-01 | 2023-03-01 | 2023-01-31 | 2023-02-24 | 0.2284 | 116.0000 | 142.5000 | 0.0000 | 0.3405 | 0.0000 | -0.0870 | 22.1300 |
| 637 | 2916 滿心 | 2023-03-01 | 2023-04-06 | 2023-02-24 | 2023-03-31 | -0.0046 | 32.8000 | 32.6500 | -0.0244 | 0.0549 | 0.0549 | -0.0751 | -1.0400 |
| 638 | 3004 豐達科 | 2023-03-01 | 2023-04-06 | 2023-02-24 | 2023-03-31 | 0.0650 | 89.2000 | 93.9000 | -0.0695 | 0.0650 | 0.0381 | -0.1037 | 4.6500 |
| 639 | 3052 夆典 | 2023-03-01 | 2023-04-06 | 2023-02-24 | 2023-03-31 | -0.0560 | 11.6000 | 10.9500 | -0.0560 | 0.0000 | 0.0000 | -0.0560 | -6.1500 |
| 640 | 6664 群翊 | 2023-03-01 | 2023-04-06 | 2023-02-24 | 2023-03-31 | 0.0648 | 108.0000 | 115.0000 | -0.0648 | 0.0648 | 0.0000 | -0.0648 | 5.8600 |
| 641 | 8931 大汽電 | 2023-02-01 | 2023-04-06 | 2023-01-31 | 2023-03-31 | 0.6282 | 46.8000 | 76.2000 | 0.0000 | 0.7286 | 0.0000 | -0.0581 | 61.8700 |
| 642 | 3078 僑威 | 2023-04-06 | nan | 2023-03-31 | 2023-04-30 | 0.2362 | 44.2500 | 54.7000 | -0.0147 | 0.3107 | 0.0000 | -0.0569 | 22.8900 |
| 643 | 3540 曜越 | 2023-04-06 | nan | 2023-03-31 | 2023-04-30 | 0.0773 | 38.8000 | 41.8000 | -0.0052 | 0.1521 | 0.0013 | -0.0649 | 7.1000 |
| 644 | 4119 旭富 | 2023-04-06 | nan | 2023-03-31 | 2023-04-30 | 0.0496 | 121.0000 | 127.0000 | 0.0000 | 0.0992 | 0.0000 | -0.0451 | 4.3500 |
| 645 | 4153 鈺緯 | 2023-04-06 | nan | 2023-03-31 | 2023-04-30 | 0.1000 | 48.0000 | 52.8000 | 0.0000 | 0.2625 | 0.0000 | -0.1287 | 9.3600 |
| 646 | 4190 佐登-KY | 2023-04-06 | nan | 2023-03-31 | 2023-04-30 | 0.0741 | 94.5000 | 101.5000 | -0.0169 | 0.1111 | 0.0000 | -0.0333 | 6.7800 |
# -*- coding: utf-8 -*-
"""correlationMatrix.ipynb
Automatically generated by Colaboratory.
Original file is located at
https://colab.research.google.com/drive/1jmq3ycgp65_NURP8cY3vg2SvTDXc5X8n
"""
#!pip install yfinance > log.txt
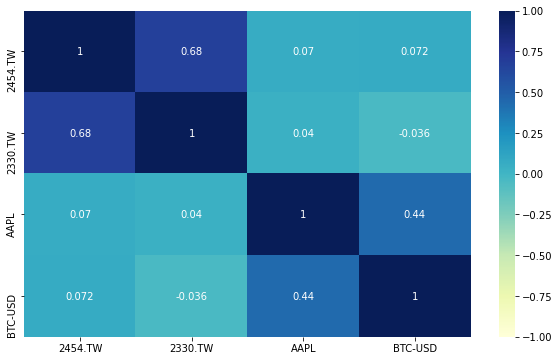
#@title 輸入 Yahoo 股票代號(例如: 2330.TW, AAPL, BTC-USD)
stock_ids = "2454.TW,2330.TW, AAPL, BTC-USD" #@param {type:"string"}
import yfinance as yf
import time
import pandas as pd
stocks = stock_ids.replace(' ', '').split(',')
price = {}
for s in stocks:
print(f'download {s}')
ss = yf.Ticker(s)
# get historical market data
hist = ss.history(period='1y')
price[s] = hist['Close']
time.sleep(3)
import seaborn
import matplotlib.pyplot as plt
plt.rcParams['figure.figsize'] = (10, 6)
seaborn.heatmap(pd.DataFrame(price).pct_change().dropna(how='any').corr(), cmap="YlGnBu",vmax=1,vmin=-1, annot=True)
finlab策略
from finlab import data
from finlab.backtest import sim
import pandas as pd
import redis
import finlab

def connect_redis():
    r = None
    pool = redis.ConnectionPool(host="localhost", port=6379, db=8)
    try:
        r = redis.Redis(connection_pool=pool, charset="utf-8")
    except Exception as err:
        logger.error(err)
    return r

# rs = connect_redis()
# rs.flushdb()

finlab.login("")
score = data.get('etl:finlab_tw_stock_market_ind')['score']
close = data.get("price:收盤價")
vol = data.get("price:成交股數")
vol_ma = vol.average(10)
rev = data.get('monthly_revenue:當月營收')
rev_year_growth = data.get('monthly_revenue:去年同月增減(%)')
rev_month_growth = 	data.get('monthly_revenue:上月比較增減(%)')

# 股價創年新高
cond1 = (close == close.rolling(250).max())

# 排除月營收連3月衰退10%以上
cond2 = ~(rev_year_growth < -10).sustain(3)

# 排除月營收成長趨勢過老(12個月內有至少8個月單月營收年增率大於60%)
cond3 = ~(rev_year_growth > 60).sustain(12,8)

# 確認營收底部,近月營收脫離近年穀底(連續3月的"單月營收近12月最小值/近月營收" < 0.8)
cond4 = ((rev.rolling(12).min())/(rev) < 0.8).sustain(3)

# 單月營收月增率連續3月大於-40%
cond5 = (rev_month_growth > -40).sustain(3)

# 流動性條件
cond6 = vol_ma > 200*1000

buy = cond1 & cond2  & cond3 & cond4 & cond5 & cond6

# 買比較冷門的股票
buy = vol_ma*buy
buy = buy[buy>0]
buy = buy.is_smallest(5)
long_position = buy.resample('M').last().reindex(close.index,method='ffill')

score_df = score >= 4
long_position *= score_df

# 做空訊號~多單遇大盤訊號轉空時出場,並反手做空指數避險
short_target = '00632R'
short_position = close[[short_target]].notna() * ~score_df
position = pd.concat([long_position, short_position], axis=1)

report = sim(position, upload=True, position_limit=1/3, fee_ratio=1.425/1000/3, stop_loss=0.08,  trade_at_price='open' ,name='XXXX', live_performance_start='2022-06-01')
print(report.get_trades().to_markdown())
from finlab import data
from finlab.backtest import sim
import finlab

finlab.login("")

close = data.get("price:收盤價")
vol = data.get("price:成交股數")
vol_ma = vol.average(10)
rev = data.get('monthly_revenue:當月營收')
rev_year_growth = data.get('monthly_revenue:去年同月增減(%)')
rev_month_growth = 	data.get('monthly_revenue:上月比較增減(%)')

# 股價創年新高
cond1 = (close == close.rolling(250).max())

# 排除月營收連3月衰退10%以上
cond2 = ~(rev_year_growth < -10).sustain(3)

# 排除月營收成長趨勢過老(12個月內有至少8個月單月營收年增率大於60%)
cond3 = ~(rev_year_growth > 60).sustain(12,8)

# 確認營收底部(單月營收月增率連續3月大於-40)
cond4 = ((rev.rolling(12).min())/(rev) < 0.8).sustain(3)

# 單月營收月增率連續3月大於-40%
cond5 = (rev_month_growth > -40).sustain(3)

# 流動性條件
cond6 = vol_ma > 200*1000

buy = cond1 & cond2  & cond3 & cond4 & cond5 & cond6

# 買比較冷門的股票
buy = vol_ma*buy
buy = buy[buy>0]
buy = buy.is_smallest(5)

report = sim(buy , resample="M", upload=True, position_limit=1/3, fee_ratio=1.425/1000/3, stop_loss=0.08,  trade_at_price='open',name='XXX', live_performance_start='2022-05-01')
print(report.get_trades().to_markdown())
from loguru import logger
from finlab import data
from finlab.backtest import sim
import finlab
import pandas as pd
import pickle
import redis
import zlib


def data_to_redis(r):
    score = data.get("etl:finlab_tw_stock_market_ind")["score"]
    close = data.get("price:收盤價")
    vol = data.get("price:成交股數")
    vol_ma = vol.average(10)
    rev = data.get("monthly_revenue:當月營收")
    rev_year_growth = data.get("monthly_revenue:去年同月增減(%)")
    rev_month_growth = data.get("monthly_revenue:上月比較增減(%)")
    EXPIRATION_SECONDS = 86400
    # Set
    r.setex("score", EXPIRATION_SECONDS, zlib.compress(pickle.dumps(score)))
    r.setex("close", EXPIRATION_SECONDS, zlib.compress(pickle.dumps(close)))
    r.setex("vol", EXPIRATION_SECONDS, zlib.compress(pickle.dumps(vol)))
    r.setex("vol_ma", EXPIRATION_SECONDS, zlib.compress(pickle.dumps(vol_ma)))
    r.setex("rev", EXPIRATION_SECONDS, zlib.compress(pickle.dumps(rev)))
    r.setex(
        "rev_year_growth",
        EXPIRATION_SECONDS,
        zlib.compress(pickle.dumps(rev_year_growth)),
    )
    r.setex(
        "rev_month_growth",
        EXPIRATION_SECONDS,
        zlib.compress(pickle.dumps(rev_month_growth)),
    )

def backtest(r):
    # Get
    score_df = pickle.loads(zlib.decompress(r.get("score")))
    close_df = pickle.loads(zlib.decompress(r.get("close")))
    vol_df = pickle.loads(zlib.decompress(r.get("vol")))
    vol_ma_df = pickle.loads(zlib.decompress(r.get("vol_ma")))
    rev_df = pickle.loads(zlib.decompress(r.get("rev")))
    rev_year_growth_df = pickle.loads(zlib.decompress(r.get("rev_year_growth")))
    rev_month_growth_df = pickle.loads(zlib.decompress(r.get("rev_month_growth")))
    # print(score_df)
    # print(close_df)
    # print(vol_df)
    # print(vol_ma_df)
    # print(rev_df)
    # print(rev_year_growth_df)
    # print(rev_month_growth_df)
    # 股價創年新高
    cond1 = close_df == close_df.rolling(250).max()

    # 排除月營收連3月衰退10%以上
    cond2 = ~(rev_year_growth_df < -10).sustain(3)

    # 排除月營收成長趨勢過老(12個月內有至少8個月單月營收年增率大於60%)
    cond3 = ~(rev_year_growth_df > 60).sustain(12, 8)

    # 確認營收底部,近月營收脫離近年穀底(連續3月的"單月營收近12月最小值/近月營收" < 0.8)
    cond4 = ((rev_df.rolling(12).min()) / (rev_df) < 0.8).sustain(3)

    # 單月營收月增率連續3月大於-40%
    cond5 = (rev_month_growth_df > -40).sustain(3)

    # 流動性條件
    cond6 = vol_ma_df > 200 * 1000
    buy = cond1 & cond2 & cond3 & cond4 & cond5 & cond6

    # 買比較冷門的股票
    buy = vol_ma_df * buy
    buy = buy[buy > 0]
    buy = buy.is_smallest(5)
    long_position = buy.resample("M").last().reindex(close_df.index, method="ffill")
    score_df = score_df >= 4
    long_position *= score_df

    # 做空訊號~多單遇大盤訊號轉空時出場,並反手做空指數避險
    short_target = "00632R"
    short_position = close_df[[short_target]].notna() * ~score_df
    position = pd.concat([long_position, short_position], axis=1)

    report = sim(
        position,
        upload=True,
        position_limit=1 / 3,
        fee_ratio=1.425 / 1000 / 3,
        stop_loss=0.08,
        trade_at_price="open",
        name="XXXXX",
        live_performance_start="2022-06-01",
    )
    # print(report.get_stats())


def connect_redis():
    pool = redis.ConnectionPool(host="localhost", port=6379, db=0)
    try:
        r = redis.Redis(connection_pool=pool, charset="utf-8")
    except Exception as err:
        logger.error(err)
    return r


if __name__ == "__main__":
    finlab.login(
        ""
    )
    r = connect_redis()
    # data_to_redis(r)
    backtest(r)
highcharts_股價走勢.ipynb
https://colab.research.google.com/drive/1W1kH3cwNUTj7hMMyF8W4wcehiWLSyAUF?usp=sharing#scrollTo=Mij5sRmwbtCP
import yfinance as yf

# 取得股價歷史資料(含臺股\美股\加密貨幣)

symbol = '2330.TW' # 臺股上市:TW 臺股上櫃:TWO
start = '2018-01-01' # 起始時間
end = '2022-12-31' # 結束時間

ohlcv = yf.Ticker(symbol).history('max').loc[start:end]


from highcharts import Highchart
import datetime
from IPython.display import HTML,display
import os

# 客製化調整參數
color = '#4285f4' # 線的顏色 (red/green/blue/purple)
linewidth = 2 # 線的粗細
title = symbol # 標題名稱
width = 800 # 圖的寬度
height = 500 # 圖的高度


# 繪圖設定
H = Highchart(width=width,height=height)

x = ohlcv.index
y = round(ohlcv.Close,2)

data = [[index,s] for index,s in zip(x,y)]
H.add_data_set(data,'line','data',color=color)

H.set_options('xAxis',{'type':'datetime'})
H.set_options('title',{'text':title,'style':{'color':'black'}}) # 設定title
H.set_options('plotOptions',{'line':{'lineWidth':linewidth,'dataLabels':{'enabled': False}}}) # 設定線的粗度
H.set_options('tooltip',{'shared':True,'crosshairs':True}) # 設定為可互動式

# 顯示圖表
H.save_file('chart')
display(HTML('chart.html'))
os.remove('chart.html')
突破策略豆知識 | 如何避免假突破?
https://colab.research.google.com/drive/1M0XxnAMZoqoOrJQP9dyJVer5Q7YyRFOA?usp=sharing
https://www.finlab.tw/breakthrough_stock_picking_strategies/
# -*- coding: utf-8 -*-
"""股價創新高動能.ipynb

Automatically generated by Colaboratory.

Original file is located at
    https://colab.research.google.com/drive/1M0XxnAMZoqoOrJQP9dyJVer5Q7YyRFOA

## 安裝套件
"""

# Commented out IPython magic to ensure Python compatibility.
# %%capture
# !pip install finlab > log.txt
# !pip install talib-binary > log.txt

"""## 股價創新高動能"""

from finlab.backtest import sim
from finlab import data

# 標的範圍為上市櫃普通股
with data.universe(market='TSE_OTC'):
    # 取得收盤價
    close = data.get("price:收盤價")
    # 股價創近200日新高
    position = (close == close.rolling(200).max())
    # 每兩週再平衡,單檔最大持股比例限制20%,停損20%
    report = sim(position, resample="2W", position_limit=0.2, stop_loss=0.2, name="股價創新高策略", upload=False)
    report.display()

"""## 創新高延續動能策略

"""

from finlab.backtest import sim
from finlab import data
with data.universe(market='TSE_OTC'):
    close = data.get("price:收盤價")
    # 近5日內有3日以上的股價創前200日新高
    position = (close == close.rolling(200).max()).sustain(5,3)
    report = sim(position, resample="2W", position_limit=0.2, stop_loss=0.2, name="創新高延續動能策略", upload=False)
    report.display()
import yfinance as yf

# 下載臺積電股票資料
df = yf.download("2317.TW", start="2014-01-01", end="2023-01-01")

# 將時間單位轉換為月份,取得每個月份的最後一筆資料,並填補缺失值
df = df.resample("M").last().bfill()

# 根據原始資料的時間索引重新排序,並填補缺失值
df = df.reindex(df.index, method="bfill")

print(df)
- FinlabDataFrame
from finlab.utils import logger
import datetime
import numpy as np
import pandas as pd
from finlab import data
import functools


class FinlabDataFrame(pd.DataFrame):
    """回測語法糖
    除了使用熟悉的 Pandas 語法外,我們也提供很多語法糖,讓大家開發程式時,可以用簡易的語法完成複雜的功能,讓開發策略更簡潔!
    我們將所有的語法糖包裹在 `FinlabDataFrame` 中,用起來跟 `pd.DataFrame` 一樣,但是多了很多功能!
    只要使用 `finlab.data.get()` 所獲得的資料,皆為 `FinlabDataFrame` 格式,
    接下來我們就來看看, `FinlabDataFrame` 有哪些好用的語法糖吧!

    當資料日期沒有對齊(例如: 財報 vs 收盤價 vs 月報)時,在使用以下運算符號:`+`, `-`, `*`, `/`, `>`, `>=`, `==`, `<`, `<=`, `&`, `|`, `~`,不需要先將資料對齊,因為 `FinlabDataFrame` 會自動幫你處理,以下是示意圖。

    <img src="https://i.ibb.co/pQr5yx5/Screen-Shot-2021-10-26-at-5-32-44-AM.png" alt="Screen-Shot-2021-10-26-at-5-32-44-AM">

    以下是範例:`cond1` 與 `cond2` 分別為「每天」,和「每季」的資料,假如要取交集的時間,可以用以下語法:

    ```py
    from finlab import data
    # 取得 FinlabDataFrame
    close = data.get('price:收盤價')
    roa = data.get('fundamental_features:ROA稅後息前')

    # 運算兩個選股條件交集
    cond1 = close > 37
    cond2 = roa > 0
    cond_1_2 = cond1 & cond2
擷取 1101 臺泥 的訊號如下圖,可以看到 `cond1` 跟 `cond2` 訊號的頻率雖然不相同,但是由於 `cond1` 跟 `cond2` 是 `FinlabDataFrame`,所以可以直接取交集,而不用處理資料頻率對齊的問題。
<br />
<img src="https://i.ibb.co/m9chXSQ/imageconds.png" alt="imageconds">

總結來說,FinlabDataFrame 與一般 dataframe 唯二不同之處:
1. 多了一些 method,如`df.is_largest()`, `df.sustain()`...等。
2. 在做四則運算、不等式運算前,會將 df1、df2 的 index 取聯集,column 取交集。
"""

@property
def _constructor(self):
    return FinlabDataFrame

@staticmethod
def reshape(df1, df2):

    isfdf1 = isinstance(df1, FinlabDataFrame)
    isfdf2 = isinstance(df2, FinlabDataFrame)
    isdf1 = isinstance(df1, pd.DataFrame)
    isdf2 = isinstance(df2, pd.DataFrame)

    both_are_dataframe = (isfdf1 + isdf1) * (isfdf2 + isdf2) != 0

    d1_index_freq = df1.get_index_str_frequency() if isfdf1 else None
    d2_index_freq = df2.get_index_str_frequency() if isfdf2 else None

    if ((d1_index_freq or d2_index_freq)
      and (d1_index_freq != d2_index_freq)
      and both_are_dataframe):

        df1 = df1.index_str_to_date() if isfdf1 else df1
        df2 = df2.index_str_to_date() if isfdf2 else df2

    if isinstance(df2, pd.Series):
        df2 = pd.DataFrame({c: df2 for c in df1.columns})

    if both_are_dataframe:
        index = df1.index.union(df2.index)
        columns = df1.columns.intersection(df2.columns)

        if len(df1.index) * len(df2.index) != 0:
          index_start = max(df1.index[0], df2.index[0])
          index = [t for t in index if index_start <= t]

        return df1.reindex(index=index, method='ffill')[columns], \
            df2.reindex(index=index, method='ffill')[columns]
    else:
        return df1, df2

def __lt__(self, other):
    df1, df2 = self.reshape(self, other)
    return pd.DataFrame.__lt__(df1, df2)

def __gt__(self, other):
    df1, df2 = self.reshape(self, other)
    return pd.DataFrame.__gt__(df1, df2)

def __le__(self, other):
    df1, df2 = self.reshape(self, other)
    return pd.DataFrame.__le__(df1, df2)

def __ge__(self, other):
    df1, df2 = self.reshape(self, other)
    return pd.DataFrame.__ge__(df1, df2)

def __eq__(self, other):
    df1, df2 = self.reshape(self, other)
    return pd.DataFrame.__eq__(df1, df2)

def __ne__(self, other):
    df1, df2 = self.reshape(self, other)
    return pd.DataFrame.__ne__(df1, df2)

def __sub__(self, other):
    df1, df2 = self.reshape(self, other)
    return pd.DataFrame.__sub__(df1, df2)

def __add__(self, other):
    df1, df2 = self.reshape(self, other)
    return pd.DataFrame.__add__(df1, df2)

def __mul__(self, other):
    df1, df2 = self.reshape(self, other)
    return pd.DataFrame.__mul__(df1, df2)

def __truediv__(self, other):
    df1, df2 = self.reshape(self, other)
    return pd.DataFrame.__truediv__(df1, df2)

def __rshift__(self, other):
    return self.shift(-other)

def __lshift__(self, other):
    return self.shift(other)

def __and__(self, other):
    df1, df2 = self.reshape(self, other)
    return pd.DataFrame.__and__(df1, df2)

def __or__(self, other):
    df1, df2 = self.reshape(self, other)
    return pd.DataFrame.__or__(df1, df2)

def __getitem__(self, other):
    df1, df2 = self.reshape(self, other)
    return pd.DataFrame.__getitem__(df1, df2)

def index_str_to_date(self):
  """財務月季報索引格式轉換

    將以下資料的索引轉換成datetime格式:

    月營收 (ex:2022-M1) 從文字格式轉為公告截止日。

    財務季報 (ex:2022-Q1) 從文字格式轉為財報電子檔資料上傳日。

    通常使用情境為對不同週期的dataframe做reindex,常用於以公告截止日作為訊號產生日。

    Returns:
      (pd.DataFrame): data
    Examples:

        ```py
        data.get('monthly_revenue:當月營收').index_str_to_date()
        data.get('financial_statement:現金及約當現金').index_str_to_date()
        ```
  """
  if len(self.index) == 0 or not isinstance(self.index[0], str):
    return self

  if self.index[0].find('M') != -1:
    return self._index_str_to_date_month()
  elif self.index[0].find('Q') != -1:
    return self._index_str_to_date_season()

  return self

@staticmethod
def to_business_day(date):

    def skip_weekend(d):
        add_days = {5: 2, 6: 1}
        wd = d.weekday()
        if wd in add_days: d += datetime.timedelta(days=add_days[wd])
        return d

    close = data.get('price:收盤價')
    return pd.Series(date).apply(lambda d: skip_weekend(d) if d in close.index or d < close.index[0] or d > close.index[-1] else close.loc[d:].index[0]).values

def get_index_str_frequency(self):

    if len(self.index) == 0:
      return None

    if not isinstance(self.index[0], str):
      return None

    if (self.index.str.find('M') != -1).all():
      return 'month'

    if (self.index.str.find('Q') != -1).all():
      return 'season'

    return None

def _index_date_to_str_month(self):

    # index is already str
    if len(self.index) == 0 or not isinstance(self.index[0], pd.Timestamp):
      return self

    index = (self.index - datetime.timedelta(days=30)).strftime('%Y-M%m')
    return FinlabDataFrame(self.values, index=index, columns=self.columns)

def _index_str_to_date_month(self):

    # index is already timestamps
    if len(self.index) == 0 or not isinstance(self.index[0], str):
      return self

    if not (self.index.str.find('M') != -1).all():
      logger.warning('FinlabDataFrame: invalid index, cannot format index to monthly timestamp.')
      return self

    index = pd.to_datetime(self.index, format='%Y-M%m') + pd.offsets.MonthBegin() + datetime.timedelta(days=9)
    # chinese new year and covid-19 impact monthly revenue deadline
    replacements = {
                    datetime.datetime(2020, 2, 10): datetime.datetime(2020, 2, 15),
                    datetime.datetime(2021, 2, 10): datetime.datetime(2021, 2, 15),
                    datetime.datetime(2022, 2, 10): datetime.datetime(2022, 2, 14),
                    }
    replacer = replacements.get
    index = [replacer(n, n) for n in index]

    index = self.to_business_day(index)

    ret = FinlabDataFrame(self.values, index=index, columns=self.columns)
    ret.index.name = 'date'

    return ret
def _index_date_to_str_season(self):

    # index is already str
    if len(self.index) == 0 or not isinstance(self.index[0], pd.Timestamp):
      return self

    q = self.index.strftime('%m').astype(int).map({5:1, 8:2, 9:2, 10:3, 11:3, 3:4, 4:4})
    year = self.index.year.copy()
    year -= (q == 4)
    index = year.astype(str) + '-Q' + q.astype(str)

    return FinlabDataFrame(self.values, index=index, columns=self.columns)

def deadline(self):
    """財務季報索引轉換成公告截止日

      將財務季報 (ex:2022Q1) 從文字格式轉為公告截止日的datetime格式,
      通常使用情境為對不同週期的dataframe做reindex,常用於以公告截止日作為訊號產生日。
      Returns:
        (pd.DataFrame): data
      Examples:
          ```py
          data.get('financial_statement:現金及約當現金').deadline()
          ```
    """
    return self._index_str_to_date_season(detail=False)

def _index_str_to_date_season(self, detail=True):

  disclosure_dates = (calc_disclosure_dates(detail)
                      .reindex_like(self)
                      .unstack())

  self.columns.name = 'stock_id'

  unstacked = self.unstack()

  ret = (pd.DataFrame({
      'value': unstacked.values,
      'disclosures': disclosure_dates.values,
    }, unstacked.index)
    .reset_index()
    .drop_duplicates(['disclosures', 'stock_id'])
    .pivot(index='disclosures', columns='stock_id', values='value').ffill()
    .pipe(lambda df: df.loc[df.index.notna()])
    .pipe(lambda df: FinlabDataFrame(df))
    .rename_axis('date')
  )

  if not detail:
      ret.index = self.to_business_day(ret.index)

  return ret

def average(self, n):
    """取 n 筆移動平均

    若股票在時間窗格內,有 N/2 筆 NaN,則會產生 NaN。
    Args:
      n (positive-int): 設定移動窗格數。
    Returns:
      (pd.DataFrame): data
    Examples:
        股價在均線之上
        ```py
        from finlab import data
        close = data.get('price:收盤價')
        sma = close.average(10)
        cond = close > sma
        ```
        只需要簡單的語法,就可以將其中一部分的訊號繪製出來檢查:
        ```py
        import matplotlib.pyplot as plt

        close.loc['2021', '2330'].plot()
        sma.loc['2021', '2330'].plot()
        cond.loc['2021', '2330'].mul(20).add(500).plot()

        plt.legend(['close', 'sma', 'cond'])
        ```
        <img src="https://i.ibb.co/Mg1P85y/sma.png" alt="sma">
    """
    return self.rolling(n, min_periods=int(n/2)).mean()

def is_largest(self, n):
    """取每列前 n 筆大的數值

    若符合 `True` ,反之為 `False` 。用來篩選每天數值最大的股票。

    <img src="https://i.ibb.co/8rh3tbt/is-largest.png" alt="is-largest">
    Args:
      n (positive-int): 設定每列前 n 筆大的數值。
    Returns:
      (pd.DataFrame): data
    Examples:
        每季 ROA 前 10 名的股票
        ```py
        from finlab import data

        roa = data.get('fundamental_features:ROA稅後息前')
        good_stocks = roa.is_largest(10)
        ```
    """
    return self.astype(float).apply(lambda s: s.nlargest(n), axis=1).reindex_like(self).notna()

def is_smallest(self, n):
    """取每列前 n 筆小的數值

    若符合 `True` ,反之為 `False` 。用來篩選每天數值最小的股票。
    Args:
      n (positive-int): 設定每列前 n 筆小的數值。
    Returns:
      (pd.DataFrame): data
    Examples:
        股價淨值比最小的 10 檔股票
        ```py
        from finlab import data

        pb = data.get('price_earning_ratio:股價淨值比')
        cheap_stocks = pb.is_smallest(10)
        ```
    """
    return self.astype(float).apply(lambda s: s.nsmallest(n), axis=1).reindex_like(self).notna()

def is_entry(self):
    """進場點

    取進場訊號點,若符合條件的值則為True,反之為False。
    Returns:
      (pd.DataFrame): data
    Examples:
      策略為每日收盤價前10高,取進場點。
        ```py
        from finlab import data
        data.get('price:收盤價').is_largest(10).is_entry()
        ```
    """
    return (self & ~self.shift(fill_value=False))

def is_exit(self):
    """出場點

    取出場訊號點,若符合條件的值則為 True,反之為 False。
    Returns:
      (pd.DataFrame): data
    Examples:
      策略為每日收盤價前10高,取出場點。
        ```py
        from finlab import data
        data.get('price:收盤價').is_largest(10).is_exit()
        ```
    """
    return (~self & self.shift(fill_value=False))

def rise(self, n=1):
    """數值上升中

    取是否比前第n筆高,若符合條件的值則為True,反之為False。
    <img src="https://i.ibb.co/Y72bN5v/Screen-Shot-2021-10-26-at-6-43-41-AM.png" alt="Screen-Shot-2021-10-26-at-6-43-41-AM">
    Args:
      n (positive-int): 設定比較前第n筆高。
    Returns:
      (pd.DataFrame): data
    Examples:
        收盤價是否高於10日前股價
        ```py
        from finlab import data
        data.get('price:收盤價').rise(10)
        ```
    """
    return self > self.shift(n)

def fall(self, n=1):
    """數值下降中

    取是否比前第n筆低,若符合條件的值則為True,反之為False。
    <img src="https://i.ibb.co/Y72bN5v/Screen-Shot-2021-10-26-at-6-43-41-AM.png" alt="Screen-Shot-2021-10-26-at-6-43-41-AM">
    Args:
      n (positive-int): 設定比較前第n筆低。
    Returns:
      (pd.DataFrame): data
    Examples:
        收盤價是否低於10日前股價
        ```py
        from finlab import data
        data.get('price:收盤價').fall(10)
        ```
    """
    return self < self.shift(n)

def groupby_category(self):
    """資料按產業分群

    類似 `pd.DataFrame.groupby()`的處理效果。
    Returns:
      (pd.DataFrame): data
    Examples:
      半導體平均股價淨值比時間序列
        ```py
        from finlab import data
        pe = data.get('price_earning_ratio:股價淨值比')
        pe.groupby_category().mean()['半導體'].plot()
        ```
        <img src="https://i.ibb.co/Tq2fKBp/pbmean.png" alt="pbmean">

        全球 2020 量化寬鬆加上晶片短缺,使得半導體股價淨值比衝高。
    """
    categories = data.get('security_categories')
    cat = categories.set_index('stock_id').category.to_dict()
    org_set = set(cat.values())
    set_remove_illegal = set(
        o for o in org_set if isinstance(o, str) and o != 'nan')
    set_remove_illegal

    refine_cat = {}
    for s, c in cat.items():
        if c == None or c == 'nan':
            refine_cat[s] = '其他'
            continue

        if c == '電腦及週邊':
            refine_cat[s] = '電腦及週邊設備業'
            continue

        if c[-1] == '業' and c[:-1] in set_remove_illegal:
            refine_cat[s] = c[:-1]
        else:
            refine_cat[s] = c

    col_categories = pd.Series(self.columns.map(
        lambda s: refine_cat[s] if s in cat else '其他'))

    return self.groupby(col_categories.values, axis=1)

def entry_price(self, trade_at='close'):

    signal = self.is_entry()
    adj = data.get('etl:adj_close') if trade_at == 'close' else data.get(
        'etl:adj_open')
    adj, signal = adj.reshape(
        adj.loc[signal.index[0]: signal.index[-1]], signal)
    return adj.bfill()[signal.shift(fill_value=False)].ffill()

def sustain(self, nwindow, nsatisfy=None):
    """持續 N 天滿足條件

    取移動 nwindow 筆加總大於等於nsatisfy,若符合條件的值則為True,反之為False。

    Args:
      nwindow (positive-int): 設定移動窗格。
      nsatisfy (positive-int): 設定移動窗格計算後最低滿足數值。
    Returns:
      (pd.DataFrame): data
    Examples:
        收盤價是否連兩日上漲
        ```py
        from finlab import data
        data.get('price:收盤價').rise().sustain(2)
        ```
    """
    nsatisfy = nsatisfy or nwindow
    return self.rolling(nwindow).sum() >= nsatisfy

def industry_rank(self, categories=None):
    """計算產業 ranking 排名,0 代表產業內最低,1 代表產業內最高
    Args:
      categories (list of str): 欲考慮的產業,ex: ['貿易百貨', '雲端運算'],預設為全產業,請參考 `data.get('security_industry_themes')` 中的產業項目。
    Examples:
        本意比產業排名分數
        ```py
        from finlab import data

        pe = data.get('price_earning_ratio:本益比')
        pe_rank = pe.industry_rank()
        print(pe_rank)
        ```
    """

    themes = (data.get('security_industry_themes')
        .copy() # 複製
        .assign(category=lambda self: self.category
            .apply(lambda s: eval(s))) # 從文字格式轉成陣列格
        .explode('category') # 展開資料
    )

    categories = (categories
        or set(themes.category[themes.category.str.find(':') == -1]))

    def calc_rank(ind):
        stock_ids = themes.stock_id[themes.category == ind]
        return (self[stock_ids].pipe(lambda self: self.rank(axis=1, pct=True)))

    return (pd.concat([calc_rank(ind) for ind in categories],axis=1)
        .groupby(level=0, axis=1).mean())

def quantile_row(self, c):
    """股票當天數值分位數

    取得每列c定分位數的值。
    Args:
      c (positive-int): 設定每列 n 定分位數的值。
    Returns:
      (pd.DataFrame): data
    Examples:
        取每日股價前90%分位數
        ```py
        from finlab import data
        data.get('price:收盤價').quantile_row(0.9)
        ```
    """
    s = self.quantile(c, axis=1)
    return s

def exit_when(self, exit):

    df, exit = self.reshape(self, exit)

    df.fillna(False, inplace=True)
    exit.fillna(False, inplace=True)

    entry_signal = df.is_entry()
    exit_signal = df.is_exit()
    exit_signal |= exit

    # build position using entry_signal and exit_signal
    position = pd.DataFrame(np.nan, index=df.index, columns=df.columns)
    position[entry_signal] = 1
    position[exit_signal] = 0

    position.ffill(inplace=True)
    position = position == 1
    position.fillna(False)
    return position

def hold_until(self, exit, nstocks_limit=None, stop_loss=-np.inf, take_profit=np.inf, trade_at='close', rank=None):
    """訊號進出場

    這大概是所有策略撰寫中,最重要的語法糖,上述語法中 `entries` 為進場訊號,而 `exits` 是出場訊號。所以 `entries.hold_until(exits)` ,就是進場訊號為 `True` 時,買入並持有該檔股票,直到出場訊號為 `True ` 則賣出。
    <img src="https://i.ibb.co/PCt4hPd/Screen-Shot-2021-10-26-at-6-35-05-AM.png" alt="Screen-Shot-2021-10-26-at-6-35-05-AM">
    此函式有很多細部設定,可以讓你最多選擇 N 檔股票做輪動。另外,當超過 N 檔進場訊號發生,也可以按照客製化的排序,選擇優先選入的股票。最後,可以設定價格波動當輪動訊號,來增加出場的時機點。

    Args:
      exit (pd.Dataframe): 出場訊號。
      nstocks_limit (int)`: 輪動檔數上限,預設為None。
      stop_loss (float): 價格波動輪動訊號,預設為None,不生成輪動訊號。範例:0.1,代表成本價下跌 10% 時產生出場訊號。
      take_profit (float): 價格波動輪動訊號,預設為None,不生成輪動訊號。範例:0.1,代表成本價上漲 10% 時產生出場訊號。
      trade_at (str): 價格波動輪動訊號參考價,預設為'close'。可選 `close` 或 `open`。
      rank (pd.Dataframe): 當天進場訊號數量超過 nstocks_limit 時,以 rank 數值越大的股票優先進場。
    Returns:
      (pd.DataFrame): data
    Examples:
        價格 > 20 日均線入場, 價格 < 60 日均線出場,最多持有10檔,超過 10 個進場訊號,則以股價淨值比小的股票優先選入。

        ```python
        from finlab import data
        from finlab.backtest import sim

        close = data.get('price:收盤價')
        pb = data.get('price_earning_ratio:股價淨值比')

        sma20 = close.average(20)
        sma60 = close.average(60)

        entries = close > sma20
        exits = close < sma60

        #pb前10小的標的做輪動
        position = entries.hold_until(exits, nstocks_limit=10, rank=-pb)
        sim(position)
        ```
    """
    if nstocks_limit is None:
        nstocks_limit = len(self.columns)

    union_index = self.index.union(exit.index)
    intersect_col = self.columns.intersection(exit.columns)

    if stop_loss != -np.inf or take_profit != np.inf:
        price = data.get(f'etl:adj_{trade_at}')
        union_index = union_index.union(
            price.loc[union_index[0]: union_index[-1]].index)
        intersect_col = intersect_col.intersection(price.columns)
    else:
        price = pd.DataFrame()

    if rank is not None:
        union_index = union_index.union(rank.index)
        intersect_col = intersect_col.intersection(rank.columns)

    entry = self.reindex(union_index, columns=intersect_col,
                         method='ffill').ffill().fillna(False)
    exit = exit.reindex(union_index, columns=intersect_col,
                        method='ffill').ffill().fillna(False)

    if price is not None:
        price = price.reindex(
            union_index, columns=intersect_col, method='ffill')

    if rank is not None:
        rank = rank.reindex(
            union_index, columns=intersect_col, method='ffill')
    else:
        rank = pd.DataFrame(1, index=union_index, columns=intersect_col)

    max_rank = rank.max().max()
    min_rank = rank.min().min()
    rank = (rank - min_rank) / (max_rank - min_rank)
    rank.fillna(0, inplace=True)

    def rotate_stocks(ret, entry, exit, nstocks_limit, stop_loss=-np.inf, take_profit=np.inf, price=None, ranking=None):

        nstocks = 0

        ret[0][np.argsort(entry[0])[-nstocks_limit:]] = 1
        ret[0][exit[0] == 1] = 0
        ret[0][entry[0] == 0] = 0

        entry_price = np.empty(entry.shape[1])
        entry_price[:] = np.nan

        for i in range(1, entry.shape[0]):

            # regitser entry price
            if stop_loss != -np.inf or take_profit != np.inf:
                is_entry = ((ret[i-2] == 0) if i >
                            1 else (ret[i-1] == 1))

                is_waiting_for_entry = np.isnan(entry_price) & (ret[i-1] == 1)

                is_entry |= is_waiting_for_entry

                entry_price[is_entry == 1] = price[i][is_entry == 1]

                # check stop_loss and take_profit
                returns = price[i] / entry_price
                stop = (returns > 1 + abs(take_profit)
                        ) | (returns < 1 - abs(stop_loss))
                exit[i] |= stop

            # run signal
            rank = (entry[i] * ranking[i] + ret[i-1] * 3)
            rank[exit[i] == 1] = -1
            rank[(entry[i] == 0) & (ret[i-1] == 0)] = -1

            ret[i][np.argsort(rank)[-nstocks_limit:]] = 1
            ret[i][rank == -1] = 0

        return ret

    ret = pd.DataFrame(0, index=entry.index, columns=entry.columns)
    ret = rotate_stocks(ret.values,
                        entry.astype(int).values,
                        exit.astype(int).values,
                        nstocks_limit,
                        stop_loss,
                        take_profit,
                        price=price.values,
                        ranking=rank.values)

    return pd.DataFrame(ret, index=entry.index, columns=entry.columns)
@functools.lru_cache def calc_disclosure_dates(detail=True):
cinfo = data.get('company_basic_info').copy() cinfo['id'] = cinfo.stock_id.str.split(' ').str[0] cinfo = cinfo.set_index('id') cinfo = cinfo[~cinfo.index.duplicated(keep='last')]
def calc_default_disclosure_dates(s): sid = s.name cat = cinfo.loc[sid].產業類別 if sid in cinfo.index else 'etf' short_name = cinfo.loc[sid].公司簡稱 if sid in cinfo.index else 'etf'
if cat == '金融業':
  calendar = {
    '1': '-05-15',
    '2': '-08-31',
    '3': '-11-14',
    '4': '-03-31',
  }
elif cat == '金融保險業':
  calendar = {
    '1': '-04-30',
    '2': '-08-31',
    '3': '-10-31',
    '4': '-03-31',
  }
elif 'KY' in short_name:
    calendar = {
    'old':{
        '1': '-05-15',
        '2': '-08-14',
        '3': '-11-14',
        '4': '-03-31',
          },
    'new':{
        '1': '-05-15',
        '2': '-08-31',
        '3': '-11-14',
        '4': '-03-31',
          },
    }
else:
  calendar = {
    '1': '-05-15',
    '2': '-08-14',
    '3': '-11-14',
    '4': '-03-31',
  }
get_year = lambda year, season: str(year) if int(season) != 4 else str(int(year) + 1)
ky_policy_check = lambda year: 'new' if year >= '2021' else 'old'
return pd.to_datetime(s.index.map(lambda d: get_year(d[:4], d[-1]) + calendar[ky_policy_check(d[:4])][d[-1]]) if 'KY' in short_name else s.index.map(lambda d: get_year(d[:4], d[-1]) + calendar[d[-1]]))
def season_end(s):
calendar = {
  '1': '-3-31',
  '2': '-6-30',
  '3': '-9-30',
  '4': '-12-31',
}
return pd.to_datetime(s.index.map(lambda d: d[:4] + calendar[d[-1]]))
disclosure_dates = data.get('financial_statements_upload_detail:upload_date') disclosure_dates = disclosure_dates.apply(pd.to_datetime)
financial_season_end = disclosure_dates.apply(season_end) default_disclosure_dates = disclosure_dates.apply(calc_default_disclosure_dates)
disclosure_dates[(disclosure_dates > default_disclosure_dates) | (disclosure_dates < financial_season_end)] = pd.NaT disclosure_dates[(disclosure_dates.diff() <= datetime.timedelta(days=0))] = pd.NaT disclosure_dates.loc['2019-Q1', '3167'] = pd.NaT disclosure_dates.loc['2015-Q1', '5536'] = pd.NaT disclosure_dates.loc['2018-Q1', '5876'] = pd.NaT
disclosure_dates = disclosure_dates.fillna(default_disclosure_dates) disclosure_dates.columns.name = 'stock_id'
if detail: return disclosure_dates return default_disclosure_dates
## 本益成長比(月營收截止日換股)

https://doc.finlab.tw/tools/guide_for_beginners/

```python
from finlab import data
from finlab.backtest import sim
import finlab

finlab.login("cdnE+4n53DXjKkN8J7spHLvPq3xwycL6gfd0PaUL+UDWOAKroWHcXUNsN82ibihU#free")


rev = data.get('monthly_revenue:當月營收')
rev_ma3 = rev.average(3)
rev_ma12 = rev.average(12)

# 營收趨勢多頭策略
cond1 = rev_ma3/rev_ma12 > 1.1
cond2 = rev/rev.shift(1) > 0.9
cond_all = cond1 & cond2

pe = data.get('price_earning_ratio:本益比')
營業利益成長率 = data.get('fundamental_features:營業利益成長率')

# 本益成長比
peg = (pe/營業利益成長率)

# 本益成長比和原訊號相乘,若不持有則相乘後等於0
position = peg*(cond_all)

# 原訊號為0的不要選,若沒加這行且策略只選到7檔,之後還是會選3檔訊號為0(不持有)的補足10檔,執行這行就會排除訊號為0。
position = position[position>0]

# 選股挑本益成長比前10小的
position = position.is_smallest(10)

print(position)


# 月營收截止日換股
position = position.reindex(rev.index_str_to_date().index, method='ffill')
print(position)
input()
report = sim(position=position, name="策略教學範例:peg_rev", stop_loss=0.1, upload=False)
report.display()
股價淨值比
from finlab import data
from finlab.backtest import sim

pb = data.get('price_earning_ratio:股價淨值比')
close = data.get('price:收盤價')

position = (1/(pb * close) * (close > close.average(60)) * (close > 5)).is_largest(20)
report = sim(position, resample='Q',mae_mfe_window=30,mae_mfe_window_step=2)
report.display_mae_mfe_analysis()
is_smallest
import pandas as pd

def is_smallest(df, n):
    return df.astype(float).apply(lambda s: s.nsmallest(n), axis=1).reindex_like(df).notna()

df = pd.DataFrame({
    'A': [1.2, 2.5, 3.1],
    'B': [2.2, 1.8, 5.5],
    'C': [3.3, 4.5, 0.7],
    'D': [4.4, 5.5, 2.2],
    'E': [5.5, 3.3, 4.4]
})

print(df)
result = is_smallest(df, 2)
print(result)

#這個 DataFrame 有 5 列 3 行,包含 15 個浮點數值。現在需要按行找到每行最小的 2 個數值所在的列,將其對應的索引置為 True。
#
#使用以下程式碼進行處理:
#
#複製
#n = 2
#result = df.astype(float).apply(lambda s: s.nsmallest(n), axis=1).reindex_like(df).notna()
#這裡的 n 為 2,在上面的程式碼中,先將 df 轉換為浮點格式,然後按行進行遍歷,對每一行調用 s.nsmallest(n) 函數找到最小的 2 個數值所在的列,其它位置置為 NaN,返回一個 Series 對象。接著把這個 Series 對象與原始 DataFrame 進行重索引,並且補缺失值為 False,最終得到一個與原始 DataFrame 一樣大小的布林值 DataFrame。
#
#執行上述程式之後,可以得到以下結果:
#
#複製
#       A      B      C      D      E
#0  False   True  False  False  False
#1   True  False  False  False   True
#2  False   True   True  False  False
#這個結果的含義是:
#
#第一行最小的 2 個數值分別位於 B 列,因此 B 列為 True,其餘為 False;
夏普值
出處: https://www.finlab.tw/python%e6%96%b0%e6%89%8b%e6%95%99%e5%ad%b8%ef%bc%9a%e5%a4%8f%e6%99%ae%e6%8c%87%e6%95%b8%e7%ad%96%e7%95%a5/
import yfinance as yf
import pandas as pd
import numpy as np

def crawl_price(stock_id):
    stock = yf.Ticker(stock_id)
    df = stock.history(period="max")
    return df


twii = crawl_price("^TWII")
print(twii)
mean = twii['Close'].pct_change().rolling(252).mean()
std = twii['Close'].pct_change().rolling(252).std()

sharpe = mean / std

# sharpe ratio 平滑
sr = sharpe
srsma = sr.rolling(60).mean()

# sharpe ratio 的斜率
srsmadiff = srsma.diff()

# 計算買入賣出點
buy = (srsmadiff > 0) & (srsmadiff.shift() < 0)
sell = (srsmadiff < 0) & (srsmadiff.shift() > 0)

# 計算持有時間
hold = pd.Series(np.nan, index=buy.index)
hold[buy] = 1
hold[sell] = 0
hold.ffill(inplace=True)
hold.plot()

# 持有時候的績效
adj = twii['Close'][buy.index]
(adj.pct_change().shift(-1)+1).fillna(1)[hold == 1].cumprod().plot()


def backtest(a, b, c, d, plot=False):
    sr = sharpe
    srsma = sr.rolling(a).mean()

    srsmadiff = srsma.diff() * 100
    ub = srsmadiff.quantile(b)
    lb = srsmadiff.quantile(c)

    buy = ((srsmadiff.shift(d) < lb) & (srsmadiff > ub))
    sell = ((srsmadiff.shift(d) > ub) & (srsmadiff < lb))

    hold = pd.Series(np.nan, index=buy.index)
    hold[buy] = 1
    hold[sell] = 0

    hold.ffill(inplace=True)

    adj = twii['Close'][buy.index]

    if plot:
        (adj.pct_change().shift(-1)+1).fillna(1)[hold == 1].cumprod().plot()
        hold.plot()

    eq = (adj.pct_change().shift(-1)+1).fillna(1)[hold == 1].cumprod()
    if len(eq) > 0:
        return eq.iloc[-1]
    else:
        return 1


maxeq = 0
for a in range(100,200,20):
    for b in np.arange(0.3, 0.9, 0.03):
        for c in np.arange(0.3, 0.6, 0.03):
            for d in range(60, 180, 10):

                eq = backtest(a,b,c,d)

                if maxeq < eq:
                    maxeq = eq
                    print(eq, a,b,c,d)