Go 並發視覺化工具整理
Go 官方的 go tool trace、go tool pprof,加上社群的 statsviz、gops、go-callvis、gotrace,可以從不同角度觀察 goroutine 與並發結構。
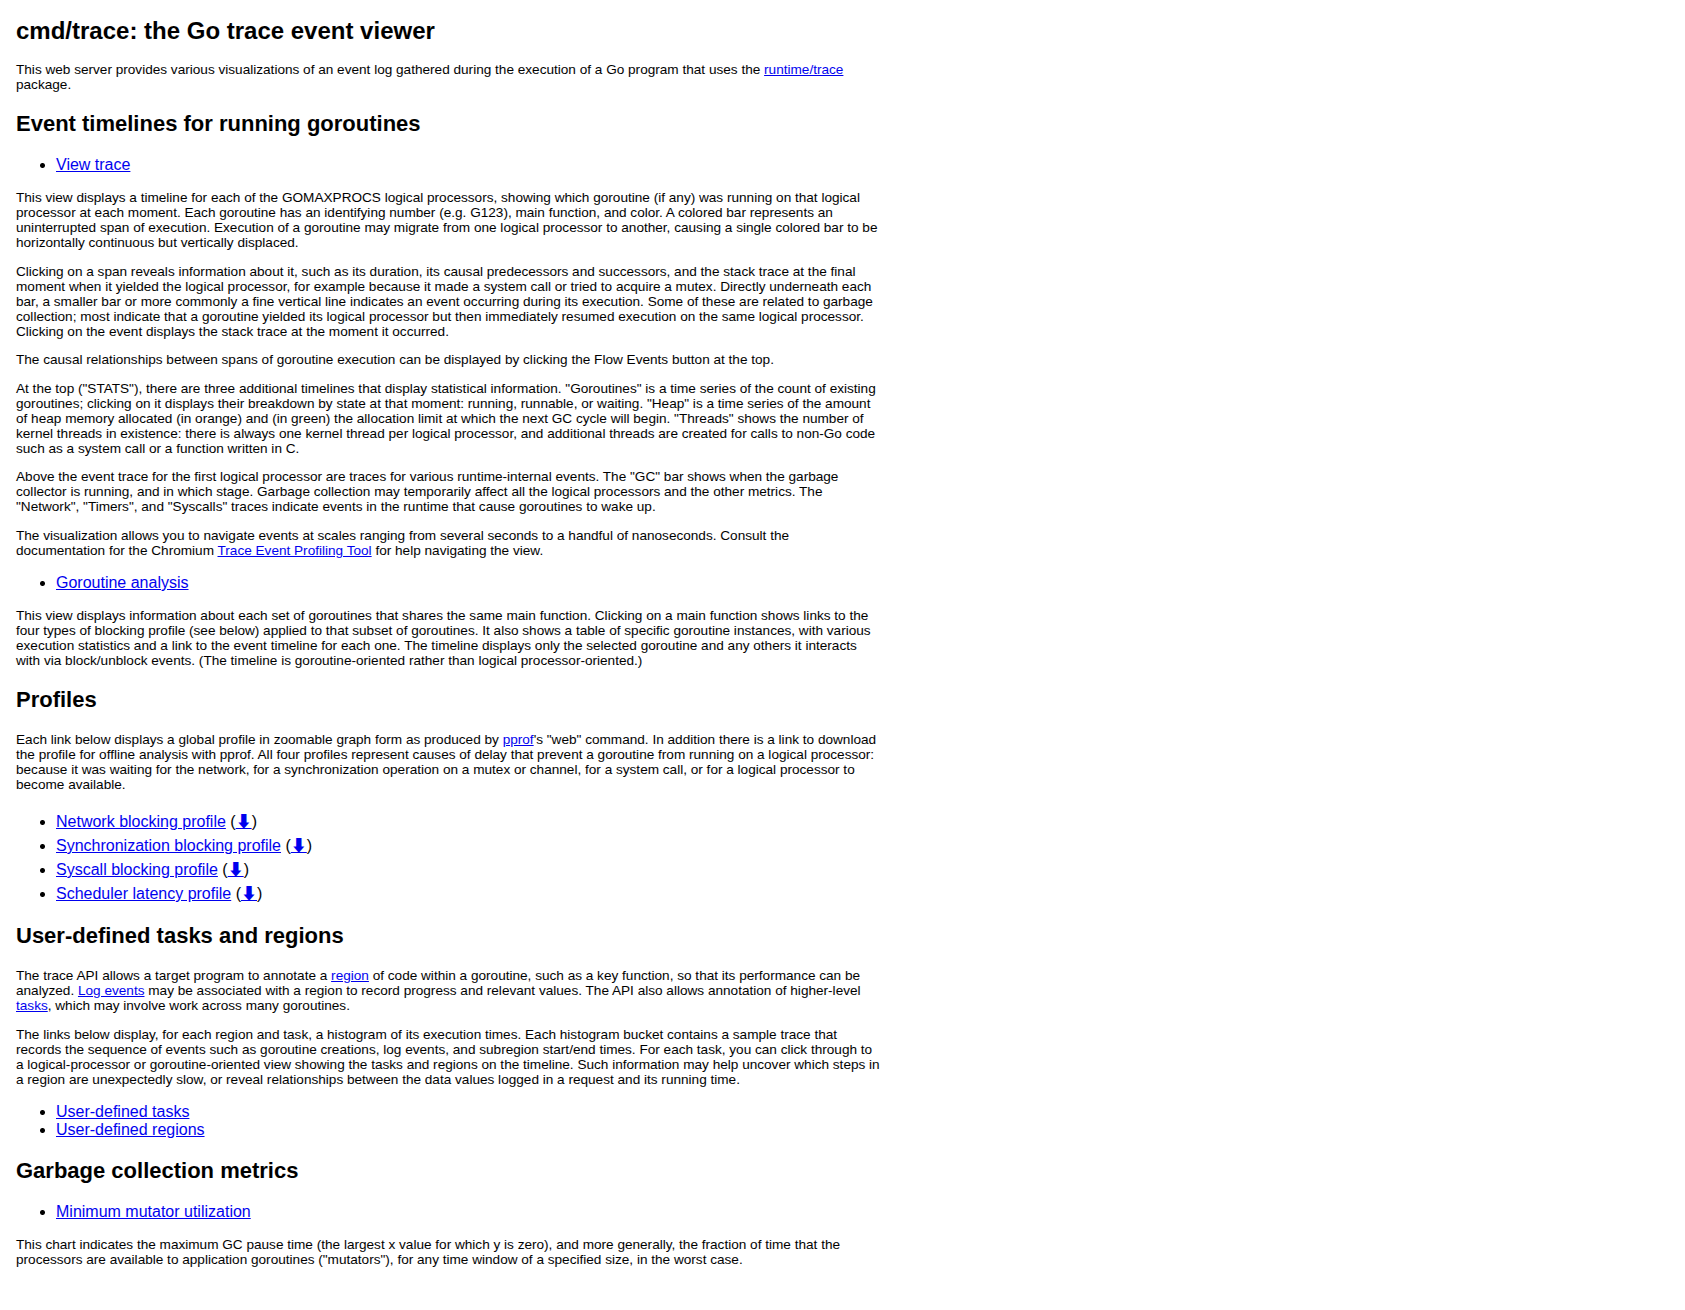
go tool trace
runtime/trace 搭配 go tool trace 產生時間軸,顯示每個 goroutine 何時執行、阻塞、等待排程,以及 GC、channel、syscall 等事件。
範例程式
package main

import (
	"fmt"
	"os"
	"runtime/trace"
	"sync"
	"time"
)

func producer(ch chan<- int, n int) {
	for i := 0; i < n; i++ {
		ch <- i
		time.Sleep(1 * time.Millisecond)
	}
	close(ch)
}

func worker(id int, ch <-chan int, wg *sync.WaitGroup) {
	defer wg.Done()
	for v := range ch {
		time.Sleep(time.Duration(v%3) * time.Millisecond)
		_ = v * v
	}
	fmt.Printf("worker %d done\n", id)
}

func main() {
	f, _ := os.Create("trace.out")
	defer f.Close()
	trace.Start(f)
	defer trace.Stop()

	ch := make(chan int, 10)
	var wg sync.WaitGroup
	for i := 0; i < 4; i++ {
		wg.Add(1)
		go worker(i, ch, &wg)
	}
	producer(ch, 40)
	wg.Wait()
}
使用步驟
# 步驟 1:執行程式,產生 trace.out
go run main.go

# 步驟 2:用瀏覽器開啟 trace UI
go tool trace trace.out
# → 自動開啟 http://localhost:PORT/

# 步驟 3:也可以指定 port 手動開啟
go tool trace -http=:8080 trace.out
在測試中收集 trace:
go test -run TestXXX -trace trace.out ./pkg
go tool trace trace.out
UI 畫面
首頁:列出可用的視圖(時間軸、goroutine 分析、blocking profile 等)
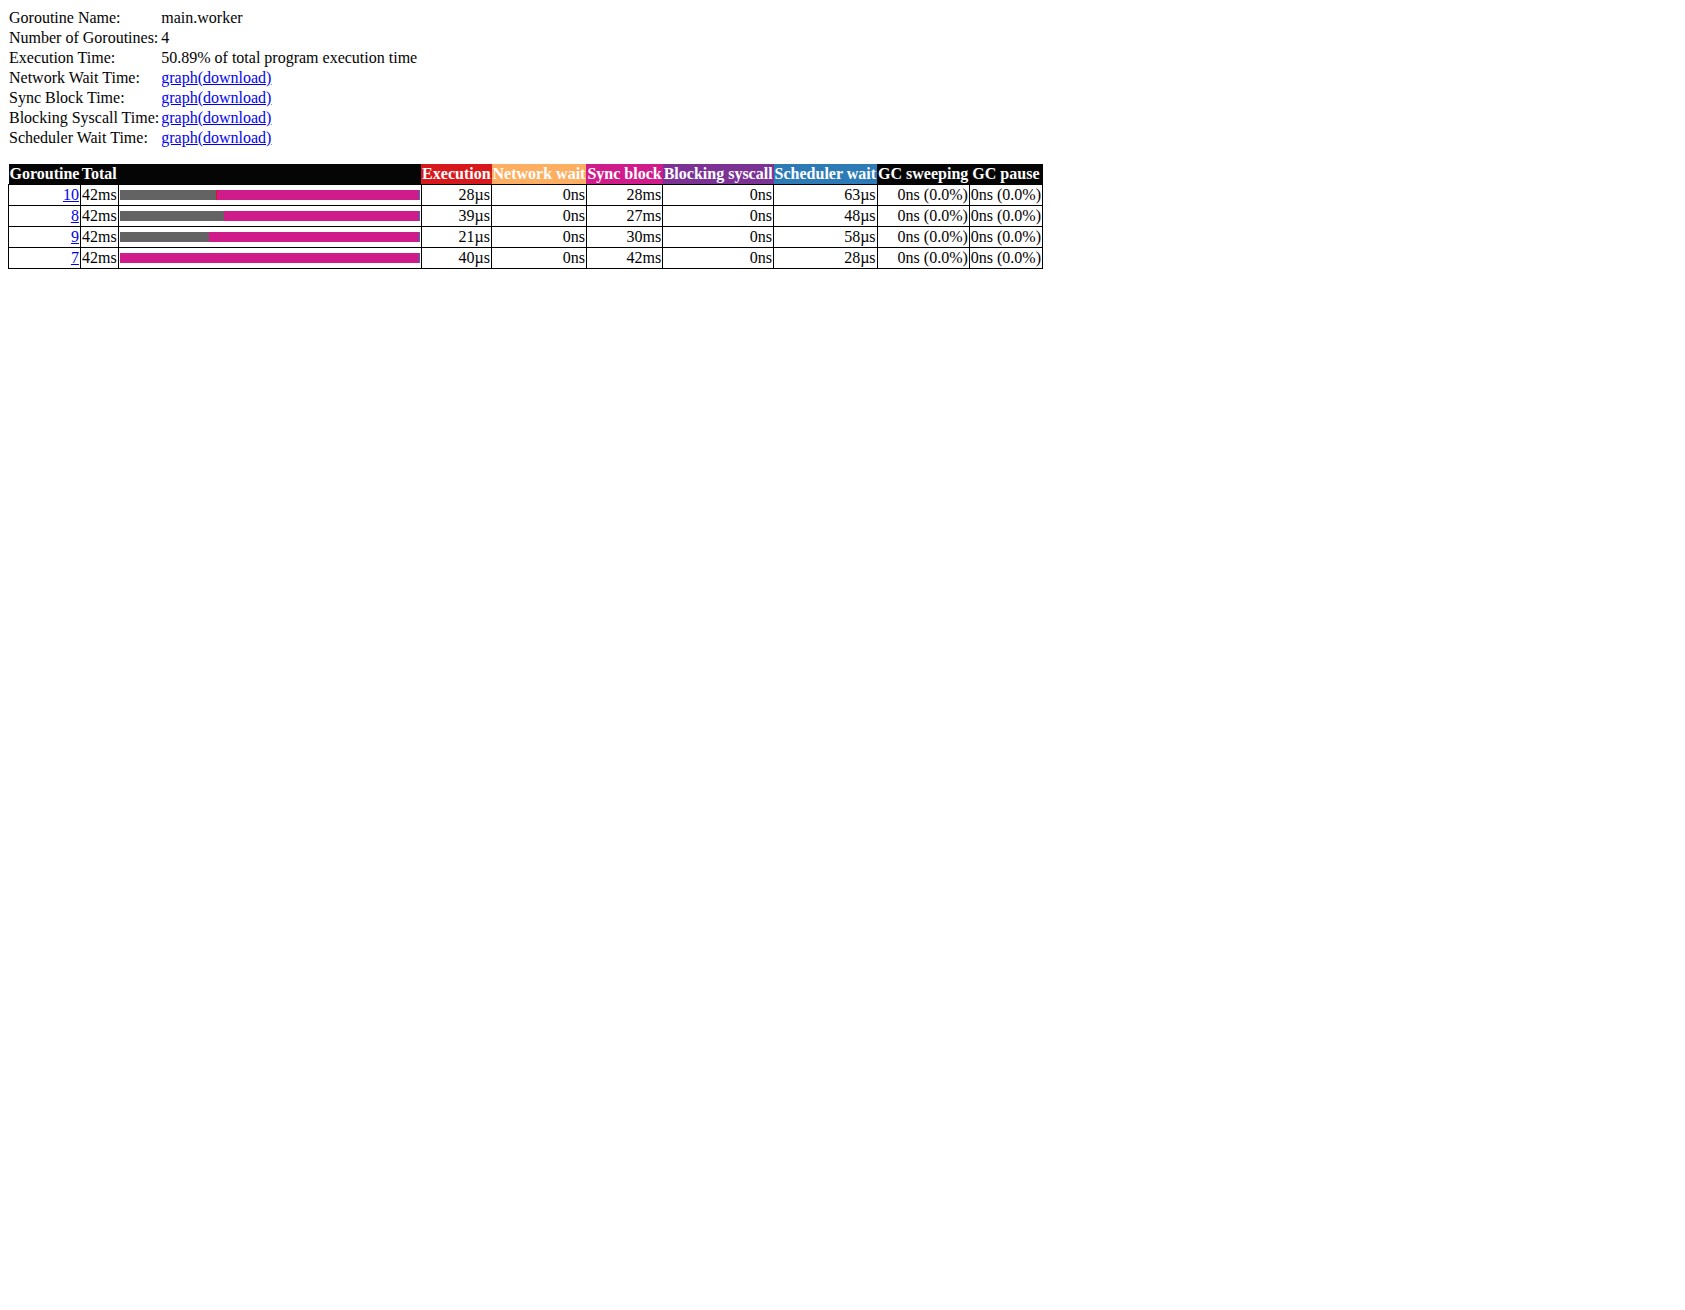
Goroutine analysis:點選 main.worker 可以看到每個 goroutine 的執行時間、Channel 阻塞時間、Scheduler 等待時間明細
適合用來找
- goroutine 排程延遲
- channel、鎖、syscall 導致的阻塞
- GC pause 時間
go tool pprof
pprof 是 Go 官方 profiling 工具,收集 CPU、記憶體、goroutine、mutex 等 profile,並以火焰圖或呼叫圖呈現。
範例程式
在程式中加入 _ "net/http/pprof" 即可開啟 /debug/pprof/ endpoint:
package main

import (
	"math"
	"net/http"
	_ "net/http/pprof"
	"runtime"
	"sync"
	"time"
)

func isPrime(n int) bool {
	if n < 2 { return false }
	for i := 2; i <= int(math.Sqrt(float64(n))); i++ {
		if n%i == 0 { return false }
	}
	return true
}

func countPrimes(start, end int) int {
	count := 0
	for i := start; i < end; i++ {
		if isPrime(i) { count++ }
	}
	return count
}

func cpuWork() {
	for {
		var wg sync.WaitGroup
		step := 50000
		for i := 0; i < runtime.NumCPU(); i++ {
			wg.Add(1)
			s := i * step
			go func(s int) {
				defer wg.Done()
				_ = countPrimes(s, s+step)
			}(s)
		}
		wg.Wait()
		time.Sleep(50 * time.Millisecond)
	}
}

func main() {
	go cpuWork()
	http.ListenAndServe(":6060", nil)
}
使用步驟
# 步驟 1:執行程式
go run main.go

# 步驟 2:瀏覽器開啟 pprof 端點,確認可用的 profile 類型
# http://localhost:6060/debug/pprof/

# 步驟 3a:收集 CPU profile 並開啟互動式火焰圖 Web UI(採樣 10 秒)
go tool pprof -http=:8081 http://localhost:6060/debug/pprof/profile?seconds=10

# 步驟 3b:收集 heap profile
go tool pprof -http=:8081 http://localhost:6060/debug/pprof/heap

# 步驟 3c:查看 goroutine stack(不需要 Web UI)
curl http://localhost:6060/debug/pprof/goroutine?debug=2
在測試中收集 profile:
go test -run TestXXX -cpuprofile cpu.out ./pkg
go tool pprof -http=:8081 cpu.out
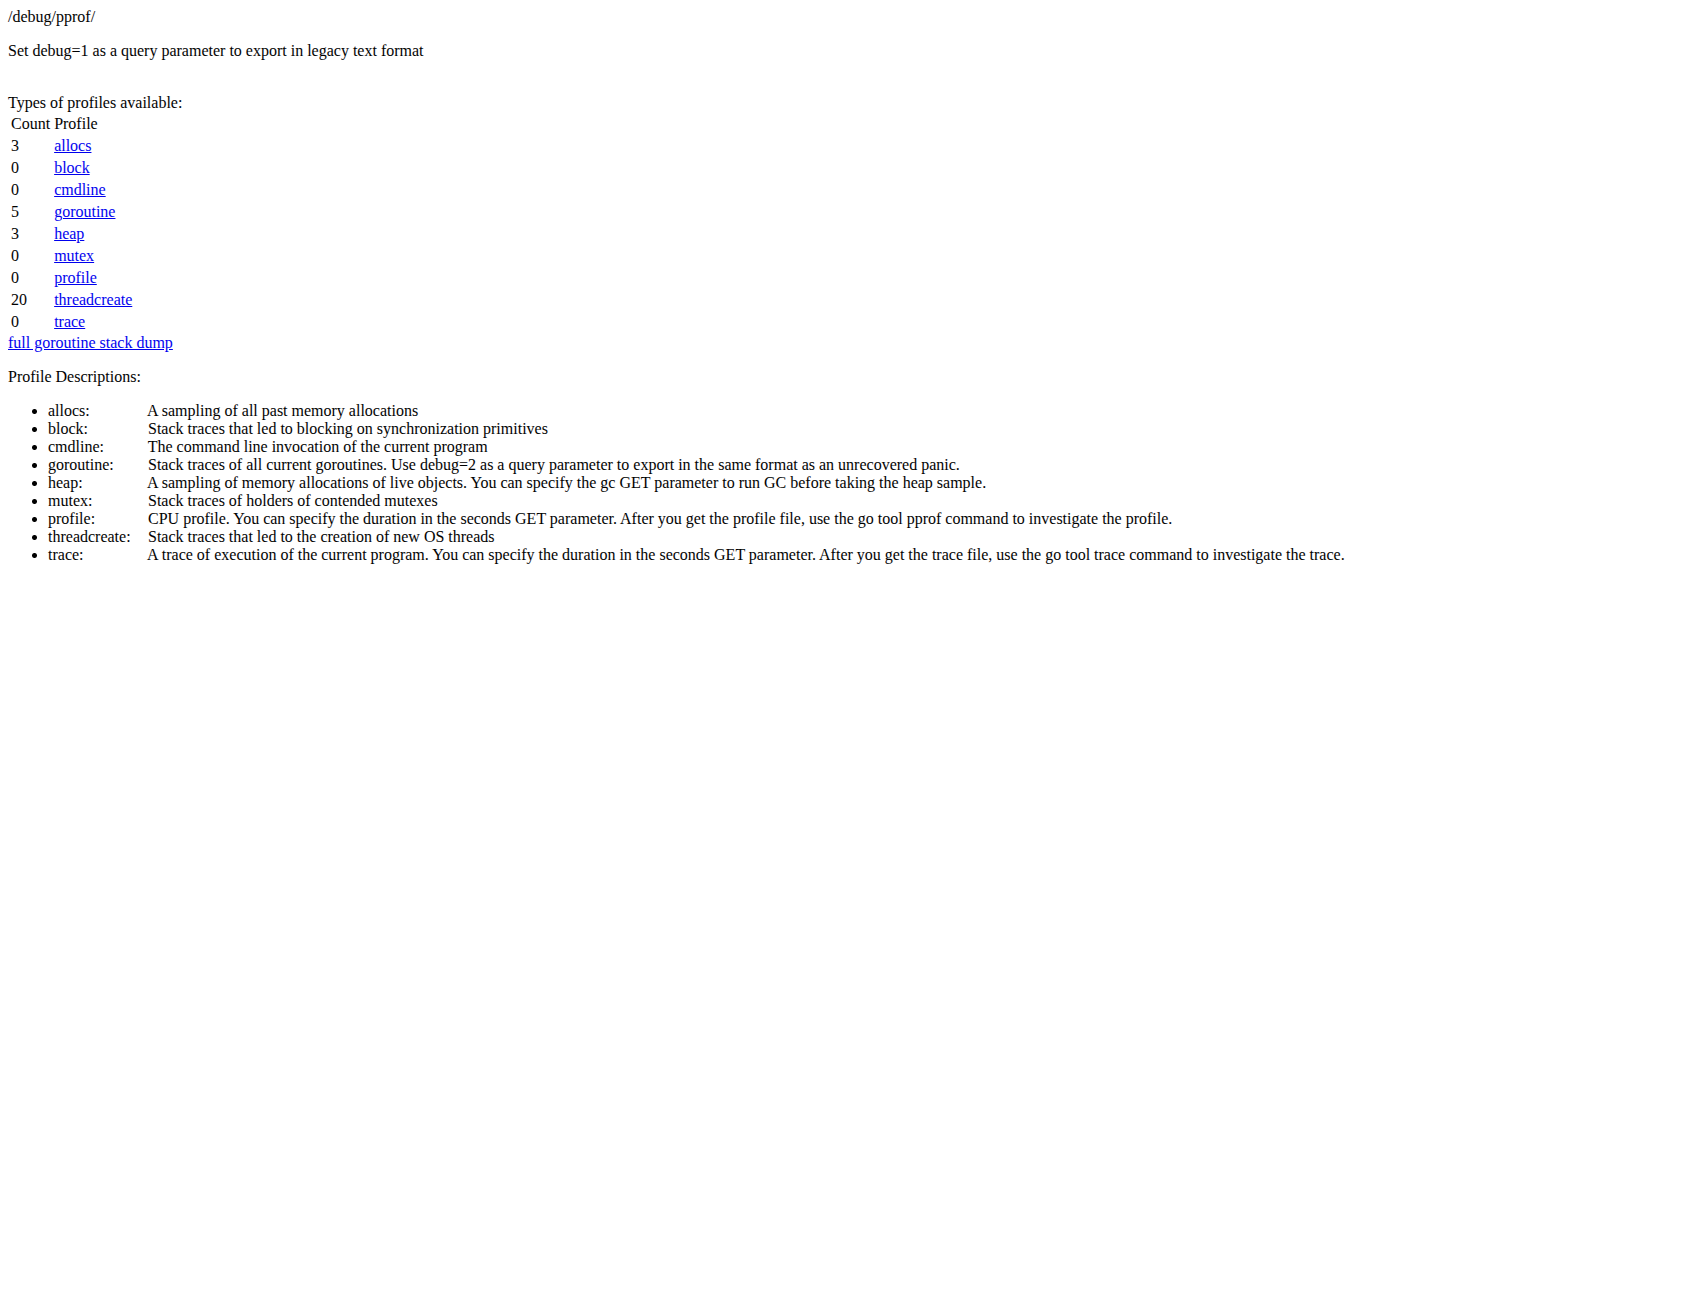
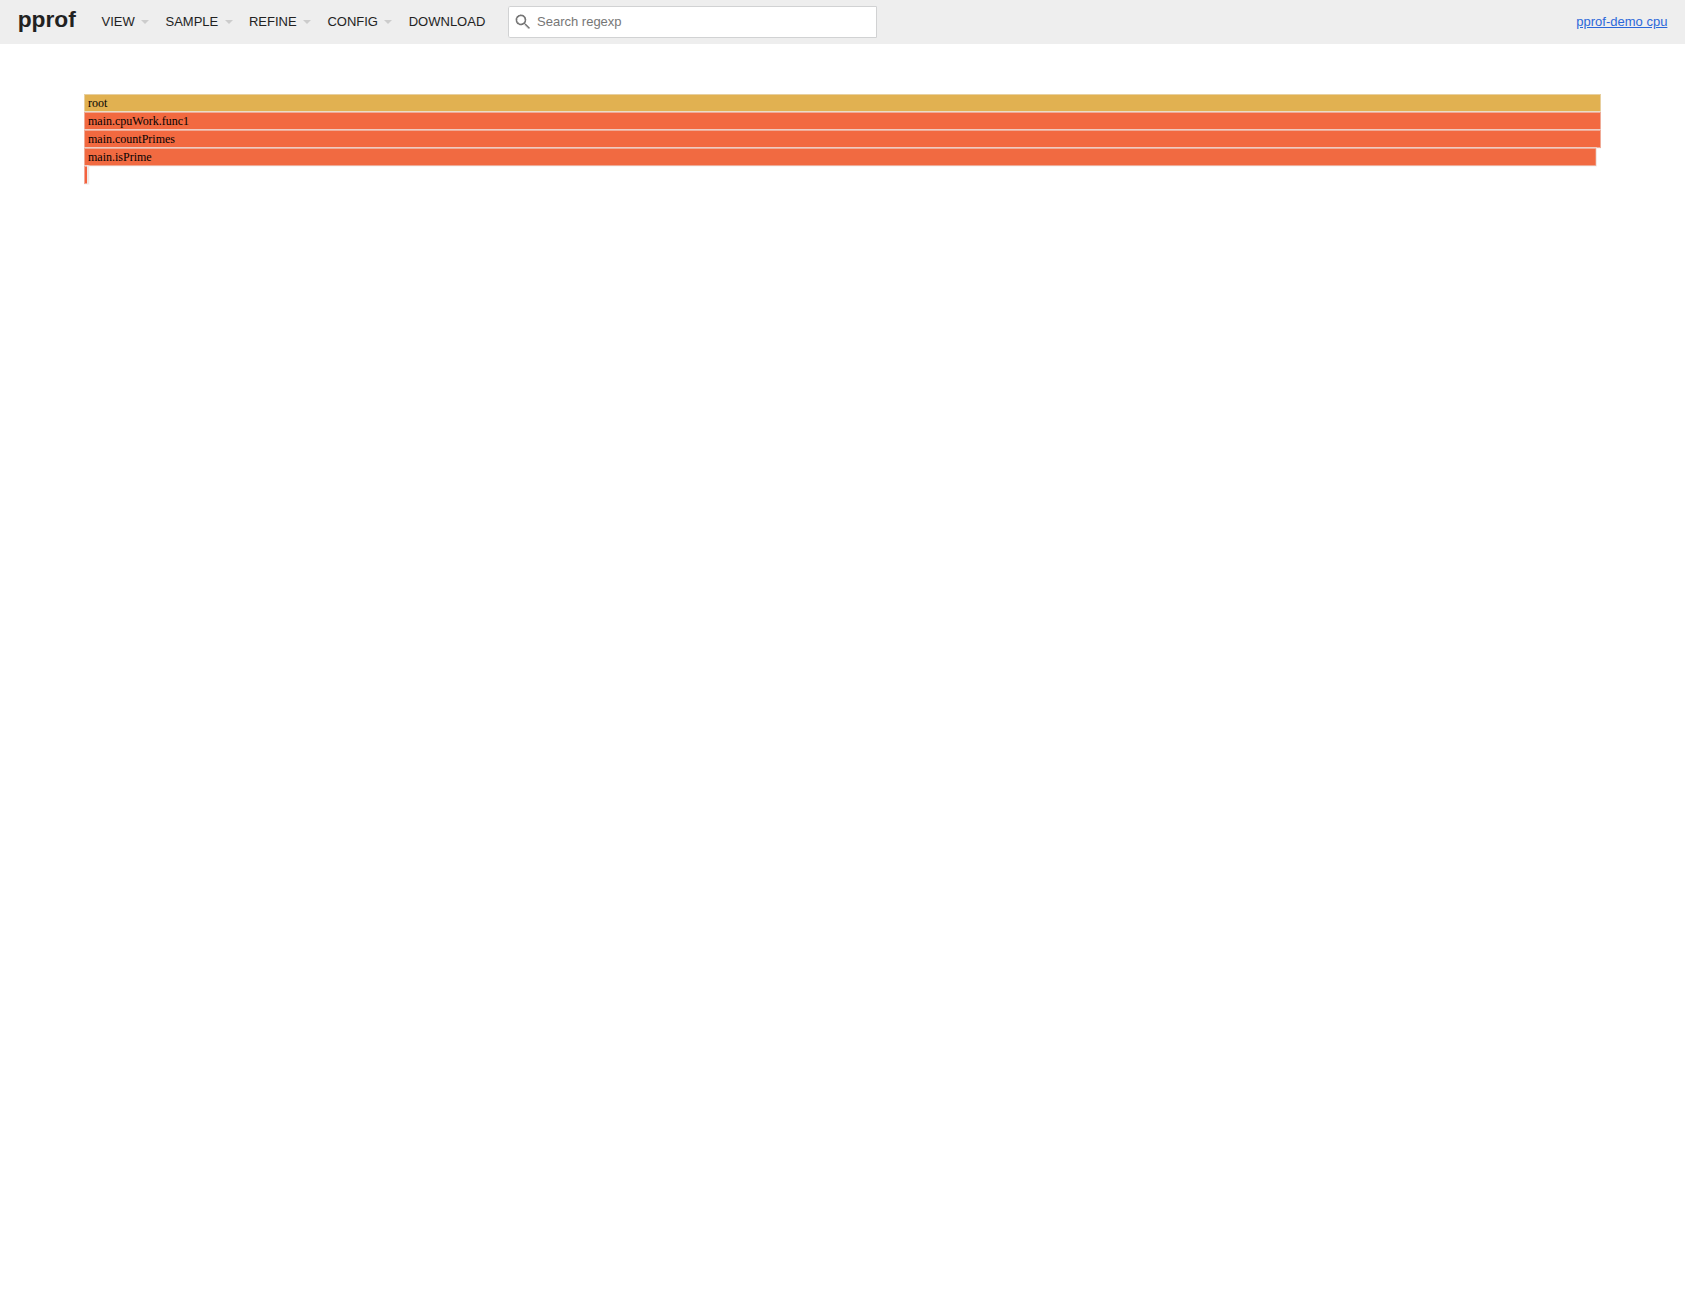
UI 畫面
/debug/pprof/ 端點:列出所有可用的 profile 類型
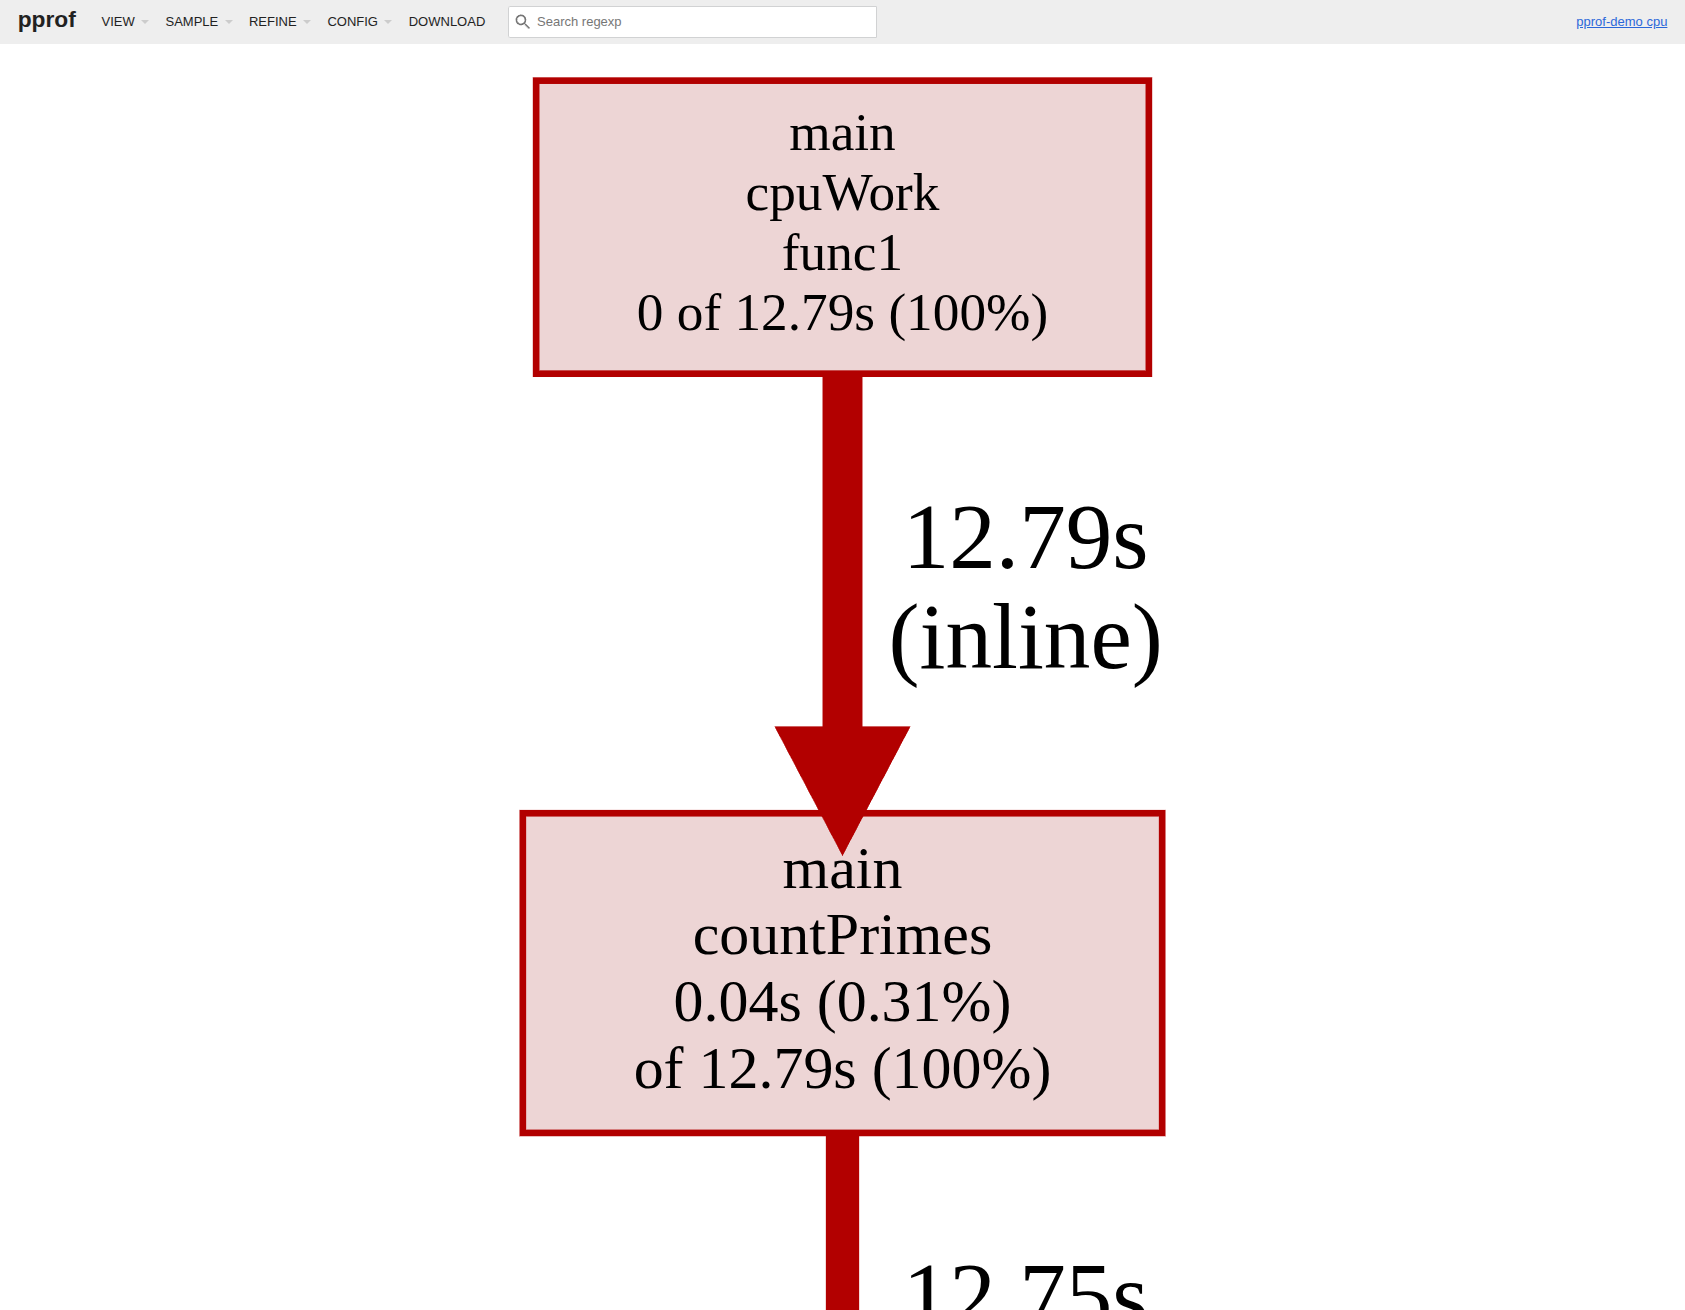
呼叫圖(Graph view):方框大小代表 CPU 佔用比例,箭頭粗細代表呼叫頻率
火焰圖(Flamegraph view):橫軸代表 CPU 時間佔比,縱軸代表呼叫深度
適合用來找
- CPU 熱點函式
- heap 記憶體洩漏
- goroutine leak(goroutine 數量異常增長)
- mutex 競爭
statsviz
statsviz 是輕量套件,整合後即可在瀏覽器即時看到 Go runtime 指標折線圖,無需主動觸發 profile。
需要 Go 1.23+
安裝
go get github.com/arl/statsviz@latest
範例程式
package main

import (
	"fmt"
	"net/http"
	"runtime"
	"sync"
	"time"

	"github.com/arl/statsviz"
)

func spawnWorkers(n int) func() {
	var wg sync.WaitGroup
	quit := make(chan struct{})
	for i := 0; i < n; i++ {
		wg.Add(1)
		go func() {
			defer wg.Done()
			for {
				select {
				case <-quit:
					return
				default:
					data := make([]byte, 512)
					_ = data
					time.Sleep(10 * time.Millisecond)
				}
			}
		}()
	}
	return func() { close(quit); wg.Wait() }
}

func main() {
	mux := http.NewServeMux()
	statsviz.Register(mux)
	go http.ListenAndServe(":6060", mux)

	fmt.Println("statsviz at http://localhost:6060/debug/statsviz/")

	var stops []func()
	for round := 0; ; round++ {
		n := (round%5 + 1) * 10
		stop := spawnWorkers(n)
		stops = append(stops, stop)
		fmt.Printf("round %d: goroutines=%d\n", round, runtime.NumGoroutine())
		time.Sleep(3 * time.Second)
		if len(stops) > 2 {
			stops[0]()
			stops = stops[1:]
		}
	}
}
使用步驟
# 步驟 1:執行程式
go run main.go

# 步驟 2:瀏覽器開啟
# http://localhost:6060/debug/statsviz/
# → 圖表自動更新,不需要其他操作
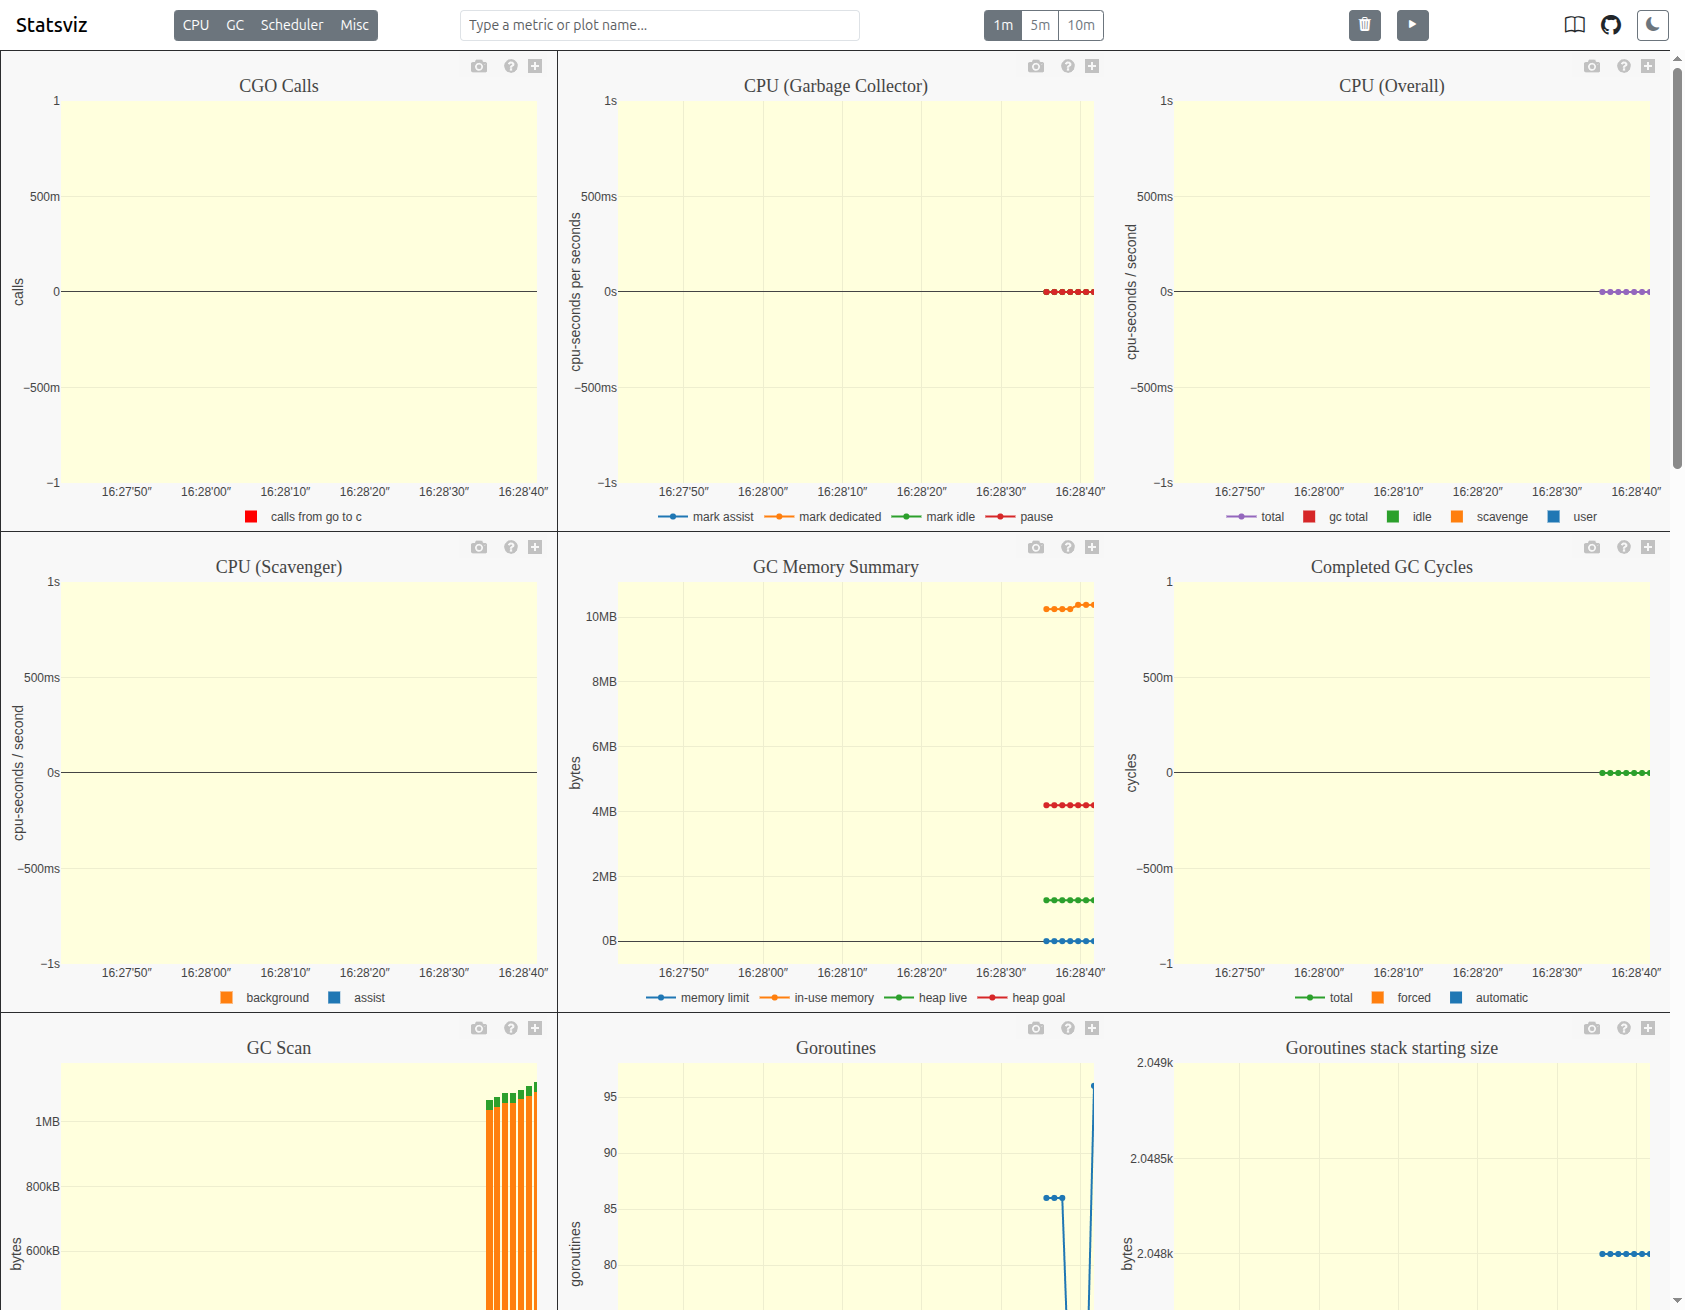
UI 畫面
即時顯示 Goroutines 數量、GC Memory Summary、CPU 使用率、Heap 等多個指標
適合用來
- 長時間觀察 goroutine 數量趨勢(是否洩漏)
- 監控 GC 頻率與 heap 大小變化
- 快速確認程式 runtime 健康狀況
gops
gops 是 Google 開發的命令列工具,列出系統上所有 Go 程式,並可即時查看其 goroutine stack 與記憶體狀態。
安裝
go install github.com/google/gops@latest
使用步驟(不需要修改程式)
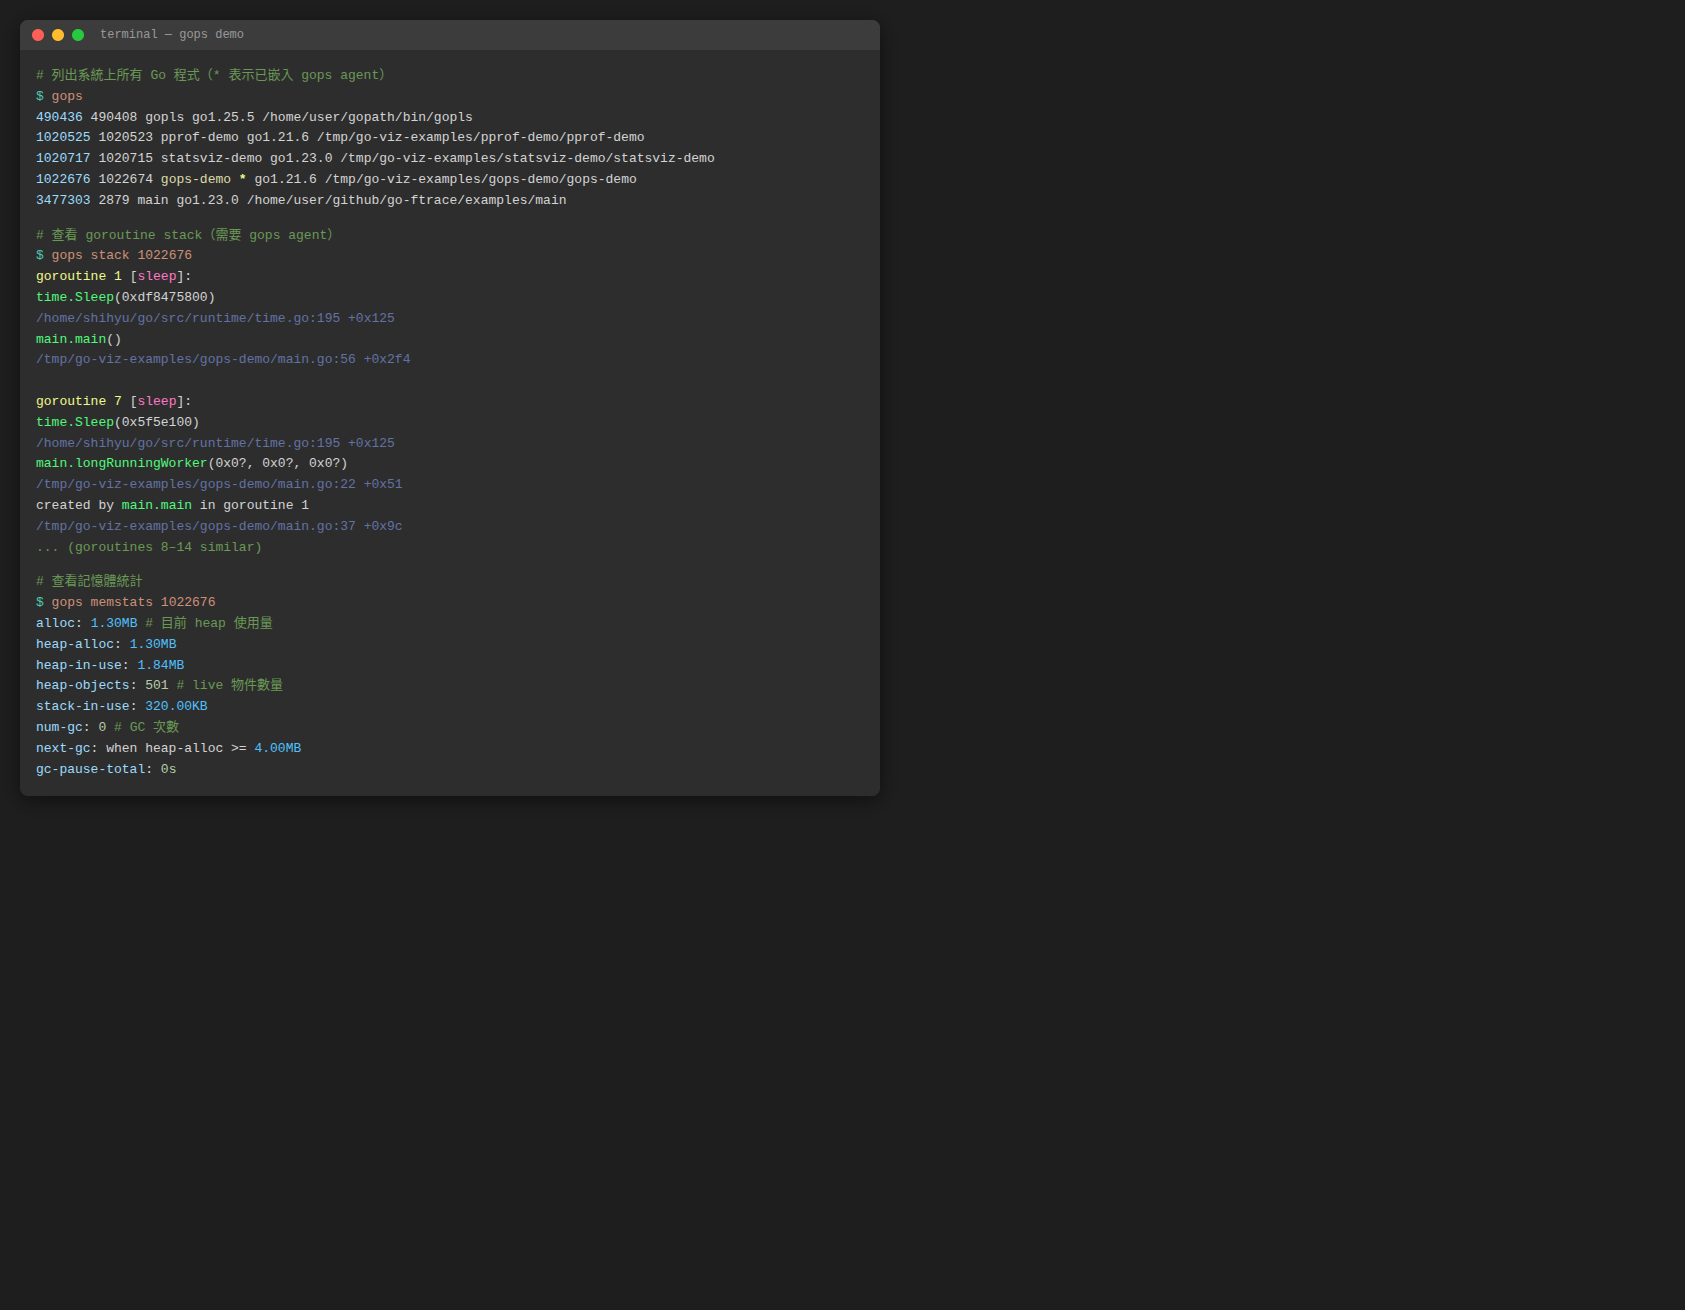
# 步驟 1:列出所有 Go 程式(* 表示已嵌入 gops agent)
gops
不需要嵌入 agent 就能看到程式清單。
深層查看(需嵌入 agent)
在程式中加入 agent:
package main

import (
	"log"
	"net/http"
	_ "net/http/pprof"
	"sync"
	"time"

	"github.com/google/gops/agent"
)

func longRunningWorker(id int, quit <-chan struct{}, wg *sync.WaitGroup) {
	defer wg.Done()
	for {
		select {
		case <-quit:
			return
		default:
			time.Sleep(100 * time.Millisecond)
		}
	}
}

func main() {
	// 啟動 gops agent
	if err := agent.Listen(agent.Options{}); err != nil {
		log.Fatal(err)
	}

	quit := make(chan struct{})
	var wg sync.WaitGroup
	for i := 0; i < 8; i++ {
		wg.Add(1)
		go longRunningWorker(i, quit, &wg)
	}
	go http.ListenAndServe(":6060", nil)
	time.Sleep(60 * time.Second)
	close(quit)
	wg.Wait()
}
# 步驟 1:執行程式
go run main.go

# 步驟 2:找到 PID(帶 * 的就是有 agent 的程式)
gops

# 步驟 3:查看 goroutine stack
gops stack <PID>

# 步驟 4:查看記憶體統計
gops memstats <PID>

# 步驟 5:觸發 CPU profile
gops pprof-cpu <PID>
輸出範例
適合用來
- 快速確認某個程式的 goroutine 數量
- 不重啟程式就能取得 goroutine stack snapshot
- 排查 goroutine leak 的第一步
go-callvis
go-callvis 透過 pointer analysis 建構 call graph,以 Graphviz 產生互動式 SVG 圖,適合理解專案結構與找 goroutine 啟動點。需要先安裝 Graphviz。
安裝
# 安裝 go-callvis
go install github.com/ofabry/go-callvis@latest

# 安裝 Graphviz(Ubuntu/Debian)
sudo apt install graphviz
使用步驟
# 步驟 1:在專案目錄執行,自動開啟瀏覽器顯示互動式圖表
go-callvis .

# 步驟 2:或輸出成 PNG 靜態圖檔
go-callvis -format=png -file=callgraph <module-name>

# 步驟 3:指定特定 package
go-callvis github.com/your/project/cmd/server
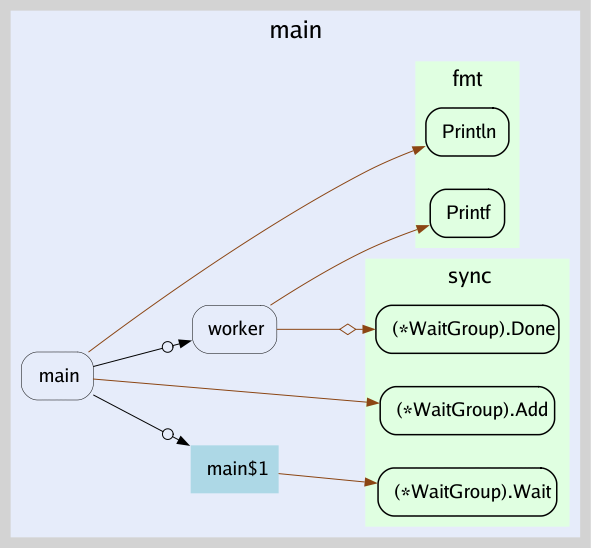
輸出範例
以下是一個 worker pool 程式的 call graph,圓形箭頭(o→)代表 goroutine 啟動:
適合用來
- 理解大型專案的函式呼叫關係
- 找出哪些地方啟動了 goroutine
- 確認 concurrent call 路徑
gotrace
gotrace 是 3D WebGL 視覺化工具,把 goroutine 與 channel 互動轉成動畫,偏教學與展示用途。
⚠️ 相容性警告:gotrace 使用 Go 1.5-1.7 時代的 trace 格式,與 Go 1.8+ 產生的 trace.out 不相容,且不支援 Go modules。目前無法在現代 Go 環境中實際執行,僅作為概念參考。若需要視覺化效果,建議改用
go tool trace。
適合說明 worker pool、fan-out、fan-in 等並發模式,讓團隊直觀理解 goroutine 的建立與阻塞。
選擇建議
| 工具 | 類型 | 適合用途 | 可用狀態 |
|---|---|---|---|
go tool trace | 官方時間軸 | 排查 goroutine 排程延遲、channel/鎖阻塞、GC pause | ✅ |
go tool pprof | 火焰圖 / 呼叫圖 | CPU 熱點、記憶體洩漏、goroutine leak 深層分析 | ✅ |
statsviz | 即時折線圖 | 長時間監控 goroutine 數量、GC、heap 趨勢(需 Go 1.23+) | ✅ |
gops | 命令列 | 快速診斷任意 Go 程式,不需事先埋點 | ✅ |
go-callvis | 呼叫圖 | 理解大型專案結構、找 goroutine 啟動點 | ✅ |
gotrace | 3D 動畫 | 教學、展示並發模式 | ❌ 不相容現代 Go |
建議使用順序:
gops:不需改程式,先確認 goroutine 數量是否異常statsviz:嵌入後長時間觀察 runtime 指標趨勢go tool pprof:發現異常時深挖 CPU 或記憶體熱點go tool trace:需要時間軸細節時使用go-callvis:要理解整體呼叫結構時補充